Three Building Blocks for Developing a Successful Investment Program
Download (Login required) Audio PDF
Achieving consistent success in the financial markets is quite an undertaking. Despite the declaration of easy money just waiting to be effortlessly taken at will, the reality is that developing a skill for long-term success is hard work. The time, effort, energy, access to helpful information, and putting capital on the line makes things more complicated than is often realized. The result is that taking on the financial markets can be one of the biggest challenges one can face.
Alternatively, many devote themselves to a long-term approach involving dollar-cost-averaging. An amount is invested each week, month, or year no matter what the markets are doing. Another method is to turn over decision-making to others, specifically professionals. All approaches have various strengths and weaknesses. Some people enjoy being active participants in the markets. This group is faced with considerable obstacles, yet overcoming them can yield gratifying and lucrative results.
The growth of technology has made information, once only available to a select few, now accessible to anyone, often in real-time. One would think that this would make things easier. However, when faced with enormous amounts of information, much of which is irrelevant, incomplete, or downright wrong, experiencing consistent success, in many ways, has never been more challenging. The markets may not be complicated, but that does make them easy to navigate and conquer.
Another avenue to success can be to enlist the help of others who are supposed to have the answers, maturity, and experience to teach us what to do. This opens the door for gurus and get-rich-quick programs, seemingly leading us on a straight and effortless path to unending riches. Unfortunately, such attempts often end with unfulfilled expectations, a lower bank account balance, and disillusion.
The reality is that becoming successful takes time, devotion, perseverance, and dedication. Success means never giving up. We must get beyond the emotions that can paralyze us on our trek to reach a level of maturity that few often attain, yet all desire. How bad do you want it?
Turning a desire into reality requires separating the talkers from the doers. What I have found are three essential basic building blocks. Each must be implemented in its entirety to experience consistent success. There may be times when luck may play a role. However, consistently performing at successful levels is an unrealized skill not easily achieved. It is also why most fail.
The Three Building Blocks
The three essential blocks are:
- Fundamental Analysis
- Technical Analysis
- Mental Analysis
The financial markets have many opportunities. Positions can include stocks, options, futures contracts, industry groups, sectors, cryptocurrencies, indexes, etc. For this discussion, stocks will be used to illustrate the concepts.
Block 1: Fundamental Analysis (FA)
Fundamental Analysis (FA) tries to determine a stock’s real or “fair market value” compared to the current price. Stocks are placed into two categories:
- Inexpensive Stocks:
- These are stocks that have a current price that is believed to be below fair market value.
- These stocks are purchased because they are considered inexpensive or cheap.
- Expensive Stocks:
- These are stocks that have a current price that is believed to be above fair market value.
- These stocks are sold because they are considered expensive.
Most guests on the financial channels are fundamental analysts. They will enthusiastically share their conclusions by proclaiming that a specific stock is cheap or expensive.
Fundamental Analysis: A Top-Down Approach
Fundamental Analysis (FA) looks at the big picture and then drills down deeper until a decision can be made. This includes:
- Macroeconomic Factors:
– These are conditions that are outside a company. This can include:
– The current state of the economy.
– Is the economy growing or contracting?
– Sector conditions
– The S&P 500 is made up of 11 different sectors. The sectors include Information Technology, Health Care, Financials, Consumer Discretionary, Communication Services, Industrials, Consumer Staples, Energy, Utilities, Real Estate, and Materials.
– How is each sector performing? Which sectors are doing the best and the worst?
– Domestic issues. This includes fiscal and monetary policies. Congress enacts fiscal policies, and the Federal Reserve enacts monetary policies.
– Geopolitical factors
– What is happening in the world? Are there heightened tensions between countries? Trade disputes? Are there events that may impact stock prices?
– Current market fixation
– The financial markets always have something to cause worry or jubilation. But, of course, this constantly changes as new events unfold.
- Microeconomic Factors
– These are conditions inside a company.
– This can include profits, products, management, revenues, earnings, future growth projections, return on equity, profit margins, etc.
– Information is accumulated and analyzed to reach conclusions concerning the soundness of a company. A company’s worthiness helps determine if investing is wise.
Valuation Comparisons
Typically, Fundamental Analysis (FA) is used to discover stocks. However, relative valuations and price context need to be established. Stock valuation comparisons are made with similar stocks and/or with a relevant index. If a stock has a current relative price lower than similar stocks or an index, a market participant is more inclined to invest. The inverse is also true.
Two Categories of Fundamental Analysis
- Quantitative Analysis allows for actual numbers to be used for measurements and calculations.
- Qualitative Analysis allows for less measurable aspects such as a company’s key executives, brand-name recognition, patents, future products (R&D), and proprietary technology and methods.
Drawbacks of Fundamental Analysis
Forecasts, no matter how educated and/or eloquently presented, are estimates or guesses. An investor may spend countless hours calculating the perceived value of a stock. Regardless, in the end, the calculated value is only a best-guess estimate.
Professional analysts publish “buy” or “accumulate” recommendations. These recommendations can be wrong. For larger stocks, there are usually multiple analysts who publish calculations. It is common for these estimates to be combined into a consensus. These numbers will immediately be “baked in” to the current price.
Additionally, if a company is in decline, an analyst may be reluctant to recommend selling a stock due to valuable relationships and access to information in the company. In such cases, objectivity can be compromised, which can produce cloudy or unrealistic conclusions.
Quarterly Earnings
Each quarter, publicly traded companies are required to release an earnings report. When released, this can cause a stock price to shoot higher or lower immediately. In addition, if the actual number varies from the consensus number, this can cause a significant price move.
It is common for a company to release an earnings report when the stock market is closed. After an earnings report is released, a stock will trade in the after-hours market and during the night. This can produce daily charts showing large gaps from one day to the next. The price most investors see will be at the open the following trading day.
Additionally, other factors can cause earnings report price movements. For example, it is common to have a conference call in which the company’s principal officers will try to explain the current earnings report and provide a future outlook. This can cause a stock price to move significantly and often contradict logic.
Additionally, a stock may move significantly before releasing an earnings report, only to move in a contrary manner after the report is released. This is called “buy the rumor and sell the news.”
Given the above variables, it is unknown how a stock will react before or after an earnings report. This can lead to some pretty wild rides.
The Biggest Shortcoming of Fundamental Analysis
Unknowns
Fundamental Analysis can involve any aspect of a stock, which leaves room for many unknowns. However, no matter how much is known, there is always something that is not known. This is a drawback of solely relying on Fundamental Analysis (FA).
An FA Purest
Pure Fundamental Analysis (FA) does not concern itself with other disciplines such as Technical Analysis (TA) or Mental Analysis (MA). As a result, market participants often combine FA with TA and MA for a more well-rounded analysis.
The FA Bible
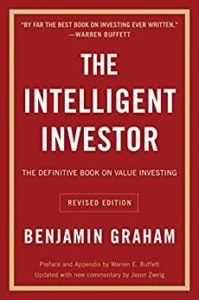
This book is considered to be the best and is quite extensive. However, it is also one of those books most investors and traders have on their shelves but often goes unread. Amazon Link
Block 2. Technical Analysis (TA)
Technical Analysis (TA) uses charts to evaluate trading opportunities by studying price trends, chart patterns, and calculation results of indicators. Historical trading activity and price movements can be valuable clues to potential future price movements.
Technical Analysis (TA) assumes current prices reflect all known information. Since all known data is immediately “baked-in” to the current price, any price at a given time is considered to be “the right price.”
TA focuses on the statistical analysis of price movements. Indicators are used to measure trends and extreme price movements. Oscillators are used to measure momentum, overbought and oversold conditions.
TA also attempts to understand the current market sentiment by measuring and analyzing whether market participants have a positive or negative outlook. This often serves as a contrary indicator in that if a majority of uninformed participants feel one way, it is usually a signal to do the opposite.
Stocks have random (non-trending) and non-random (trending) price movements which can be measured and evaluated using Technical Analysis (TA).
TA assumptions can often lead to self-fulfilling prophecies. Since millions of market participants are looking at the same thing simultaneously, Technical Analysis events, such as two lines crossing over each other, can induce action. Reactions may appear to be triggered by proper chart analysis when actually it was triggered by investors acting concurrently and in the same fashion.
TA Indicators
Technical Analysis (TA) uses indicators, which are calculations based on price and/or volume that seek to provide insight for determining the likelihood of future price movements. Thousands of indicators have been developed with the hope of providing unique insight. In addition, some investors create their own indicators. Technical Analysis software applications often allow for creating personalized indicators in addition to making adjustments to existing indicators.
Participants typically discover and use their favorite indicators. Some market participants use only a few indicators, while others may use many. It is common for beginners to learn and implement others’ interpretation styles, which may be helpful. However, this can also cause a reliance rather than developing an independent skill. Outside information and commentary sources are essential but should ultimately result in making a self-reliant conclusion.
TA Indicator Categories
TA indicators fall into two basic categories:
- Oscillators measure momentum as well as overbought or oversold
- Momentum is a short-term movement that may last for a few hours or days. For example, a stock price may fall for 1-2 days, yet the trend remains positive.
- An overbought condition occurs when prices have moved higher too far and too fast and are likely to pause by retreating or moving sideways. Sometimes this may indicate a trend reversal. The inverse is true for oversold conditions.
- Moving averages measure trend condition and strength by analyzing the direction of the trend. Trend health is also observed by studying the moving average in relation to the current price. The current price is typically above the moving average in a positive environment, while the moving average line is also climbing. The inverse is true for negative environments.
Technical Analysis (TA) is also used to observe support and resistance levels.
Support occurs when prices fall, and selling pressure is exhausted at a specific price or price range. This level is met by buyers who enter new positions and/or short-sellers who close existing positions. Prices often bounce, which can be a short-term move or lead to a continuation of declining prices.
Resistance occurs when prices rise and buying enthusiasm is exhausted at a specific price or price range. This level is met by sellers who exit existing positions and/or short-sellers who open new positions. Prices often retreat, which can be a short-term move or lead to a continuation of rising prices.
The Perfect Indicator?
The search for the perfect indicator(s) is an endless journey. This frustration motivated me to create my own approach to Technical Analysis (TA) based on a unique mindset. Instead of trying to find an “end-all” indicator(s), I decided to plot all of the most popular indicators on numerous charts. Each chart produces TA Events.
TA Events
A TA Event is anything on a chart that might initiate action or provide helpful insight. TA events can result from self-fulfilled prophecies and/or psychological forces at work. It does not matter which is which. The important thing is that applicable TA events occur regardless of the reason behind them. This has proved valuable and insightful for decision-making.
The Conesus Approach
An indicator that may have provided insight at one time may be irrelevant or insignificant at another time. Therefore, rather than using just a few indicators, numerous indicators are studied and analyzed each day. When combined, a picture is formed. This technique has been very effective in creating foresight rather than relying on hindsight. The Consensus Approach is the system and philosophy that was developed.
TA Flexibility
Technical Analysis is flexible. TA allows participants to be involved in different markets such as stocks, bonds, futures, forex, and cryptocurrencies. Additionally, TA can be adapted to any time frame. Finally, TA allows for adjustments, modifications, and experimentation.
TA uses visual cues, which many participants find more helpful than only relying on numbers. Visual representations allow for proper historical context. As a result, future expectations and projections can be determined.
TA Drawbacks
- A disadvantage of Technical Analysis (TA) can be “analysis paralysis.” This occurs when observing many indicators at the same time. Indicators often contradict or fail to confirm each other, which can result in an inability to make a decision.
This may seem to contradict The Consensus Approach. However, the implementation is different. The Consensus Approach uses a more extensive focus within the context of the big picture. An individual indicator is often used to make decisions without an understanding of the larger context. Rather than relying on one or two indicators to make decisions, all of the indicators are taken together to reach a conclusion or consensus. This conclusion is never black and white. However, a positive or negative bias can be concluded, which has proven to be very effective.
- The market climate is constantly changing, often from day-to-day or even hour-to-hour. Additionally, prices behave differently in uptrends than in downtrends. Generally, uptrends are slower and can last a long time. On the other hand, downtrends are usually quicker due to increased emotions and typically don’t last as long as uptrends.
- Technical Analysis (TA) can be inconsistent. What worked one time may not work at another time and vice versa.
- TA can quickly become subjective rather than objective, which can be positive. However, it is not easy to develop this skill, and it will take time. An unhealthy reliance on others as gurus rather than as guides to independence may result.
The TA Bible
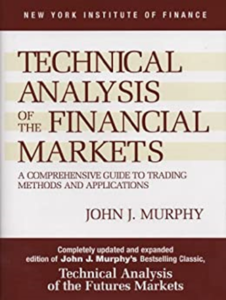
Numerous books cover TA. Some are good, some are bad, and some are just OK. However, most books end up saying the same things over and over. One of the most popular books on Technical Analysis is Technical Analysis of the Financial Markets by John J. Murphy. Although a bit outdated, it can be a helpful tool. Amazon Link
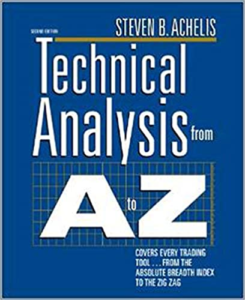
On a personal level, my early TA foundation was laid by the book “Technical Analysis from A to Z” by Steven Achelis, the founder of Equis International and the creator of the TA software application Metastock. Amazon Link
It is essential to have access to TA software when learning Technical Analysis. For many years, I used Metastock, but in the last decade, I have switched to stockcharts.com.
Block 3. Mental Analysis (MA)
Mental Analysis is one area that is often assumed yet is more often neglected. Yet, MA is the most significant and most potent area to develop if success is to be experienced. In this article, it is listed as number three but could easily be number one. MA is not as exciting as FA and TA, yet if MA is not implemented, failure in the financial markets is pretty much guaranteed.
It is one thing to have a good foundation of analysis tools and techniques and quite a different thing to overcome the powerful emotions that plague each market participant. Mental Analysis (MA) deals with understanding the fear and greed that each participant needs to control and use advantageously to experience consistent success.
Many fail in Mental Analysis (MA) and resort to developing an investment program of long-term growth based on average returns, dollar-cost averaging, and assuming that the markets will go up over long periods. Can you do better?
Each market participant owes it to themselves to become the best investor or trader possible. Understanding and controlling one’s emotions are the only way to excel. All other educational and experiential efforts are in vain if MA is omitted.
The idea of self-evaluation and soberly addressing personal shortcomings head-on is not very pleasant. Confronting weaknesses, displaying various emotional responses, and deviating from a developed plan is difficult to admit and conquer. However, if successfully implemented, MA will be the biggest reason for experiencing consistent success.
The MA Bible
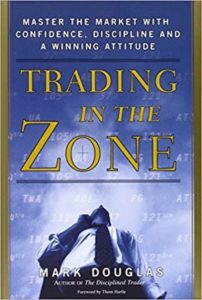
The book cited as being the best at developing Mental Analysis (MA) is “Trading in the Zone” by Mark Douglas. This is an excellent book and is imperative reading for anyone genuinely seeking stock market success. Amazon Link
Conclusion
Fundamental Analysis (FA), Technical Analysis (TA), and Mental Analysis (MA) each play an essential role when finding, entering, holding, and exiting stock positions. Each type of analysis is often used individually but is the most powerful when implemented in conjunction with each other. Each type of analysis has its perspective strengths and weaknesses. The Consensus Approach, which uses an array of indicators to reach big-picture conclusions, was initially developed to implement Technical Analysis (TA). However, The Consensus Approach can also be applied to all three building blocks resulting in a well-rounded and robust investing or trading program.


