How to Know if a Market is Trending or Not Trending
Trend Condition Analysis (TCA)
Download (Login required) Audio PDF
How to Know if a Market is Trending or Not Trending
One common frustration experienced by investors and traders is distinguishing between times when a position is trending versus times of non-trending. Additionally, if a trend exists, knowing the strength or weakness of that trend can be very helpful when making decisions. The ADX Average Directional Movement (ADX) Indicator could be the tool you need to take more control of your trades and investments. The ADX can provide helpful insight during all phases a position is held, from initiation, holding period, and exit.
Definitions
First, some quick definitions are in order.
Position:
-
-
- Any tradeable instruments such as stocks, bonds, futures contracts, etc.
- For the sake of this discussion, only the S&P500 (SPX) Index will be used for illustration. However, the information in this article can be transferred to other markets as well as individual stocks, mutual funds, and ETFs.
-
Market Participants
-
-
- It is common to classify market participants as either investors or traders. For this discussion, both will be referred to as “market participants.”
-
What’s the difference?
Classification can impact brokerage accounts and taxes. Please note that brokerage requirements and tax laws change frequently. Please seek the appropriate professional counsel. *
*Authors note: I don’t particularly appreciate having to “pass-the-buck” when posting educational articles and find it aggravating when authors resort to such tactics. I prefer sharing information that allows readers to take full responsibility and control based on the information contained in each article. However, due to the fact that I am not a licensed financial or tax professional forces me to refer you to others when dealing with these two critical areas.
Time
The length of time a position is held will determine if you are an investor or a trader.
Investor: A position is held for longer than one year.
Trader: A position is held for less than one year, often called Swing Trading.
How does my classification apply to TCA?
TCA will usually impact traders the most, whereas investors may not be as concerned with timing. However, this assumption may be too simple to always be true. Please use the information in this article as advantageously as possible and apply it to your situation.
Typically, TCA can be applied to all time frames but is often more critical for:
-
-
-
-
- Intermediate-term (weeks-to-months) traders
- Short-term (days-to-weeks) traders
- Long-term Investors usually hold positions for months, years, or even decades.
-
-
-
TCA: An Area that Is Often Overlooked
Trend Condition Analysis (TCA) is often not considered yet is dealt with constantly. Many successful market participants implement trend-based systems. A trend-based system does not necessarily need to be complicated to produce consistent success since positions are usually on the right side of the trend.
- If the trend is up, long positions are initiated and held until the trend stops.
- If the trend is down, long positions are exited, and/or short positions are initiated until the trend stops.
However, Trend Condition Analysis (TCA) is often ignored or unrealized. A nice strong trend can usually be spotted, captured, ridden, and then exited for a tidy profit. It sounds simple and easy. If only things were always that simple!
However, little to no attention is paid to the condition of the trend. Essential questions that should be asked include:
- How is it known if the trend is strong, getting stronger, or staying strong?
- How is it known if the trend is weak, getting weaker, or staying weak?
TCA attempts to evaluate trend conditions, leaving market participants the freedom and flexibility to implement new positions, modify existing positions, and avoid undesirable positions.
The Three Stages
TCA comes into play during each of the three stages of a trade.
- The Open: when a position is initiated.
- It can be very gratifying to enter a new position and see prices quickly move in the desired direction. This allows for stop-loss orders to be placed or other money management tactics to be implemented. The feeling of being on offense rather than on defense, with protective measures in place, allows for increased relaxation and more objective observation.
- The Holding Period: when a position is held.
- The length a position is held should be determined before entry. However, adjustments may be desired. If a trend is strong but the objectives have been reached, there may be a desire to ride the position longer.
- Conversely, the strength of the trend will change daily. What was once a strong trend may start to weaken, which may lead to a trend reversal. In such cases, decisions are required which may involve:
– Exiting the position altogether with a realized profit.
– Implementing profit-keeping techniques such as stop-loss adjustments and/or covered-call writing.
– Implementing hedging strategies such as purchasing protective options, or opening an inverse position to counteract any losses.
- The Close: When a position is closed by realizing either a profit, loss, or breakeven result.
- TCA can be used to help evaluate when a position should be closed. Typically, this should be decided before a position is initiated. Limitations to this freedom may have to do with positions based on time, such as option strategies. However, a market participant may decide to close a position when the current trend starts to weaken or show signs of exhaustion. The trend may still be in the desired direction, but movement may slow down after a strong move or look at reversing.
- Loss avoidance: It can be very frustrating to enter a new position only to have prices move sluggishly without conviction, go sideways, or fizzle out after a short burst. TCA can measure current conditions and help to make decisions if a position is not moving as expected.
The Friendly Trend
Market participants often use trend-based systems. “The trend is your friend until the end” is a common theme. This can be wise and form the foundation for consistent success. The basic idea is to find the trend, get on it, and ride it until it changes. When the trend changes, participants will often exit or establish positions in the opposite direction. Trend trading can be profitable but requires education, skills, diligence, and management.
Finding the Trend
How can the trend be found? Technical Analysis (TA), which implements chart reading, can help measure price movements and provide insight. TA uses moving averages and oscillators to determine trends. Many indicators have gained popularity and are readily available, often for free.
Trend-based trading systems usually involve:
- Moving averages to qualify and quantify trends
- Oscillators to help determine overbought and oversold conditions
- Momentum indicators may combine moving averages and oscillators to determine price direction.
Trend Frustration
At first glance, measuring trend strength may seem insignificant but can develop into full-blown frustration that incites emotional responses. As prices switch from trending to non-trending, traders may begrudgingly and even unknowingly adjust their strategies. Intermediate-term traders may become short-term traders, and short-term traders may become day-traders without intending to do so.
Whether consciously or subconsciously, strategy adjustments allow emotions to play a more significant role in decision-making, which can be dangerous. Non-trending environments can cause re-actions rather than pro-actions. This reduces overall effectiveness and increases anxiety.
The Weak Trend
Moving averages and oscillators assume a trend is always present. However, trends can have different strengths. There may be a strong trend that is relatively easy to spot or a weak trend with prices bouncing around but not really going anywhere. Unfortunately, when a decision is made to enter, the trend’s strength is unknown or not considered, which can lead to undesired results.
Also, participants who do measure the trend may enter during trendless times hoping a new trend will start, only to experience floundering price movement or exit signals after a short move. Prices can remain trendless for lengthy periods, which can cause moving averages and oscillators to overreact. Conversely, during strong trend periods, moving averages and oscillators may underreact.
There is a randomness, as well as non-randomness, that coexists in the markets. Trend-based systems give signals with the assumption that prices are always non-random or trending. Stated differently, Trend Condition Analysis (TCA) can help determine random from non-random environments.
Another weakness of moving averages and oscillators can be false signals. This can be frustrating when a new trend is spotted, only to reverse, leading to a quick loss. This cannot always be eliminated but can possibly be reduced by implementing TCA.
Another characteristic of a weak trend is when a relatively small move can promptly lead an oscillator to give overbought or oversold extreme conditions. A position that was designed to be open for weeks or months may only last a few days. TCA can be used to refine position implementation and management.
Trend Reversals
Moving averages and oscillators lag price movement. This can be beneficial if the desired trend resumes but can be disappointing when reversals occur. Reversals that are measured using moving averages and oscillators can take time to develop actionable signals. This can leave a considerable amount of a move “on the table” when looking to enter or exit.
Additional disadvantages of relying on moving averages and oscillators include whipsaws, false-breakouts, and fizzling convictions. This can produce losses, decrease winning percentages, and induce overtrading. When a strategy is developed and tested, what looked good on paper suddenly doesn’t look as good when implemented under real-life conditions.
Tweaking
Market participants will often “tweak” a system to seek improvements. The reasoning is that “if a little tweaking is good, a lot of tweaking must be better.” Typically, over-tweaking leads to additional frustration since adjustments don’t produce the desired results. Increased tweaking often correlates with increased impediments to success.
A better alternative is avoiding over-tweaking, developing a realistic plan, and then sticking to the plan, realizing there will be times of success and failure. A perfect system does not exist. Proper discipline and realistic trading rules can overcome this but are often neglected or ignored.
Trend Condition Analysis (TCA)
When analyzing current prices, trend analysis involves the following factors:
- Is there a trend?
- Is the current trend strong or weak?
- What is the direction of the trend?
Is there a tool that can differentiate between times of trending and times of non-trending? Yes! The nice thing is this indicator is not magical or mystical. There has not been a conspiracy to keep this indicator a secret. It has been around for a long time. It is a technical analysis indicator typically prepacked with technical analysis software, both desktop and web-based versions. The default settings are usually adequate. The indicator is the Average Directional Movement Indicator (ADX).
The ADX Average Directional Movement Indicator
The ADX Indicator was developed by Welles Wilder, who sadly passed away as this article was being written, in 1978. The ADX Indicator is flexible since it can be applied to any liquid market, index, or stock. Also, there are variations of interpretation that can be tailored to each market participant’s analysis style. No indicator is perfect, but the ADX is quite helpful.
TCA is Not for Everyone
TCA is probably not applicable to:
- Dividend and interest investors who hold long-term positions with income being the primary objective rather than capital gains.
- Investments that are perpetually held with no intention of selling.
However, even long-term investors may find TCA helpful when increasing position sizes.
The Basic Concept of TCA
The idea is to use trending strategies when there is a clear trend and either sit on the sidelines or delay entering new positions when a trend is weak or non-existent.
Additionally, when looking to exit, the ADX Indicator can measure when a strong trend may be turning into a weak trend (suggesting exhaustion or a climax), which can possibly lead to a reversal.
Non-Trending Strategies
Some strategies can take advantage of non-trending periods for those who may want to expand opportunities. “Sideways strategies” can produce consistent returns. The overall idea is to take advantage of up and down trends as they occur. Then, during sideways markets, implement other strategies. Multiple time frames and methods can be implemented at the same time.
Most market participants only make gains when prices go up, excluding interest or dividends. Out of three possibilities, there is a 66% chance an investment will not perform as expected. That leaves a 33% chance of success. To help with the other 66% probability, hedging, income-producing, and various sideways strategies can be used. These strategies are often short-term and are executed within the context of owning a longer-term investment.
Alternatively, during downtrends and times of weak trends, possible alternatives include exiting current positions and doing nothing until the uptrend resumes. Or enter short positions that increase in value as prices fall. A well-rounded set of strategies that take advantage of different market conditions and various time frames can prove lucrative over the long term.
Market participants may desire to only have long positions without implementing additional income-producing or hedging strategies.
Calculation
An attempt has been made to keep an explanation of the ADX Indicator applicable to real-life conditions. Rather than go through the intricacies of calculation, more focus is placed on interpretation. Good calculation articles are abundant by searching for “ADX Indicator.”
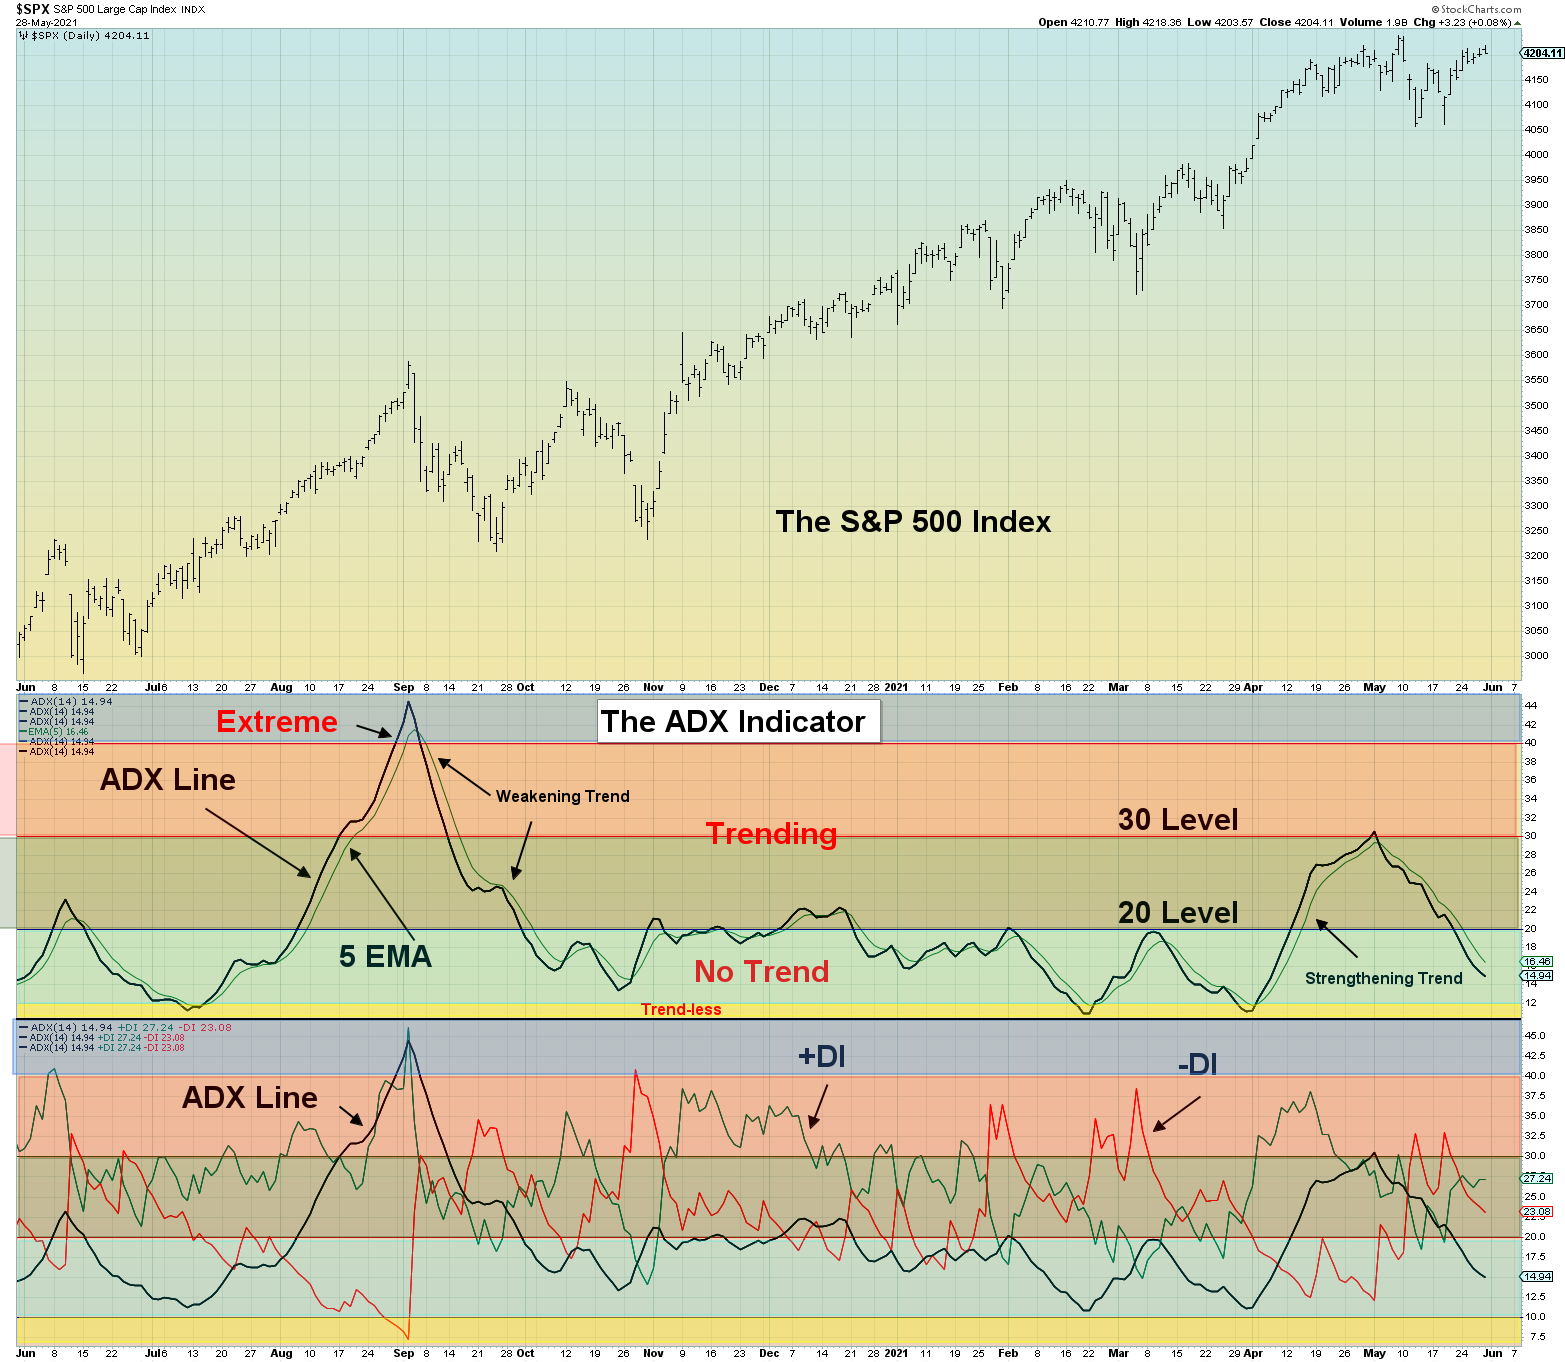
Interpretation
A trend is getting stronger as the ADX Line goes higher. A trend is weakening or entering a trendless environment as the ADX Line declines.
With the S&P 500 (SPX) Index, readings above 50 and below 10 are rare and typically occur at buying or selling climaxes. Hence, the ADX Line typically ranges within 10-50, with readings above 40 suggesting impending exhaustion or reversal.
Please note that a falling ADX does not mean the trend has ended or changed. It means a trend is weakening, which may signal that position adjustments may be needed soon.
Implementing the ADX Average Directional Movement Indicator
The ADX Indicator can become an integral tool for making decisions. A methodology can be developed such as:
- Charts displaying the ADX Indicator are usually consulted first.
- If a trend is present, additional analysis tools can be used for insight.
- If a trend is weakening, additional analysis tools can determine an exit strategy or if entrance delays are warranted.
As with most TA indicators, personal objectives and risk tolerances vary, which allows for simple or more sophisticated ADX interpretations to be implemented.
All examples will be demonstrated using the S&P 500 (SPX).
implementation 1
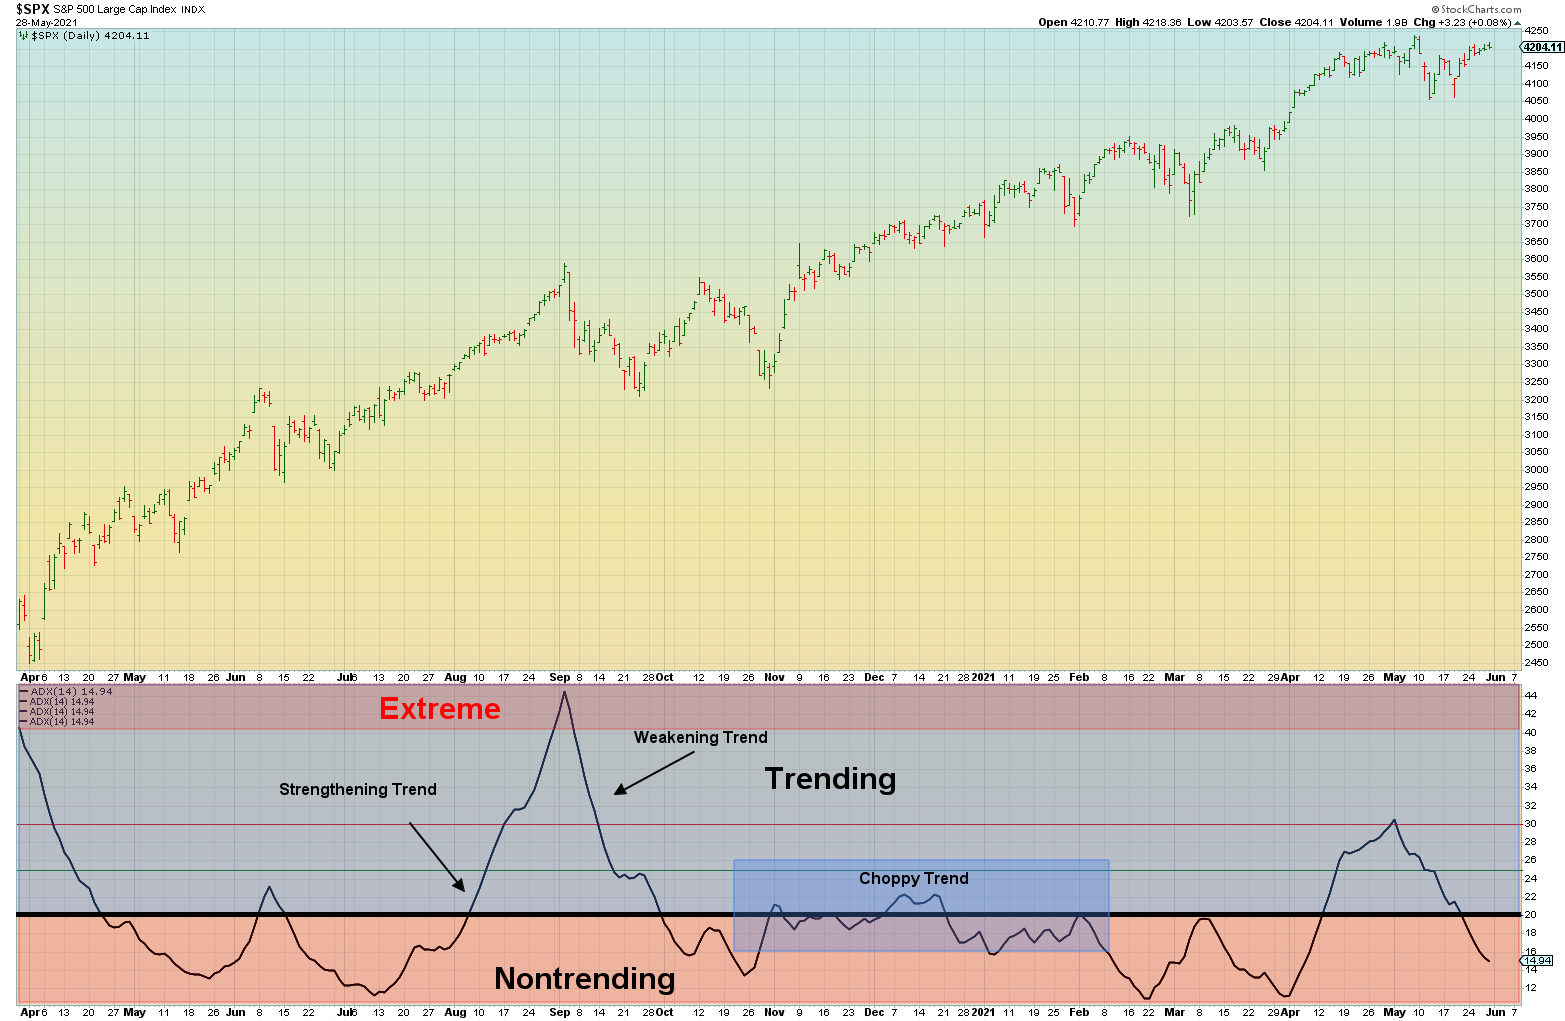
- Trending: An ADX reading above 20.
- Strengthening Trend: 20-40 and climbing.
- Weakening Trend: 40-20 and declining.
- Exhaustion: Readings above 40 but can go above 50.
- Non-Trending: An ADX reading below 20.
- Trend-lessness: Below 10 (rarely seen).
Once it is determined if prices are trending or not, the following evaluation and possible steps include:
- Non-Trending: Look to implement sideways strategies.
- Trending in the desired direction: Hold, or increase position size.
- Trending but getting weaker: Hold, or decrease position size.
- Trending in an undesired direction: Exit or implement hedging strategies.
Implementation 2
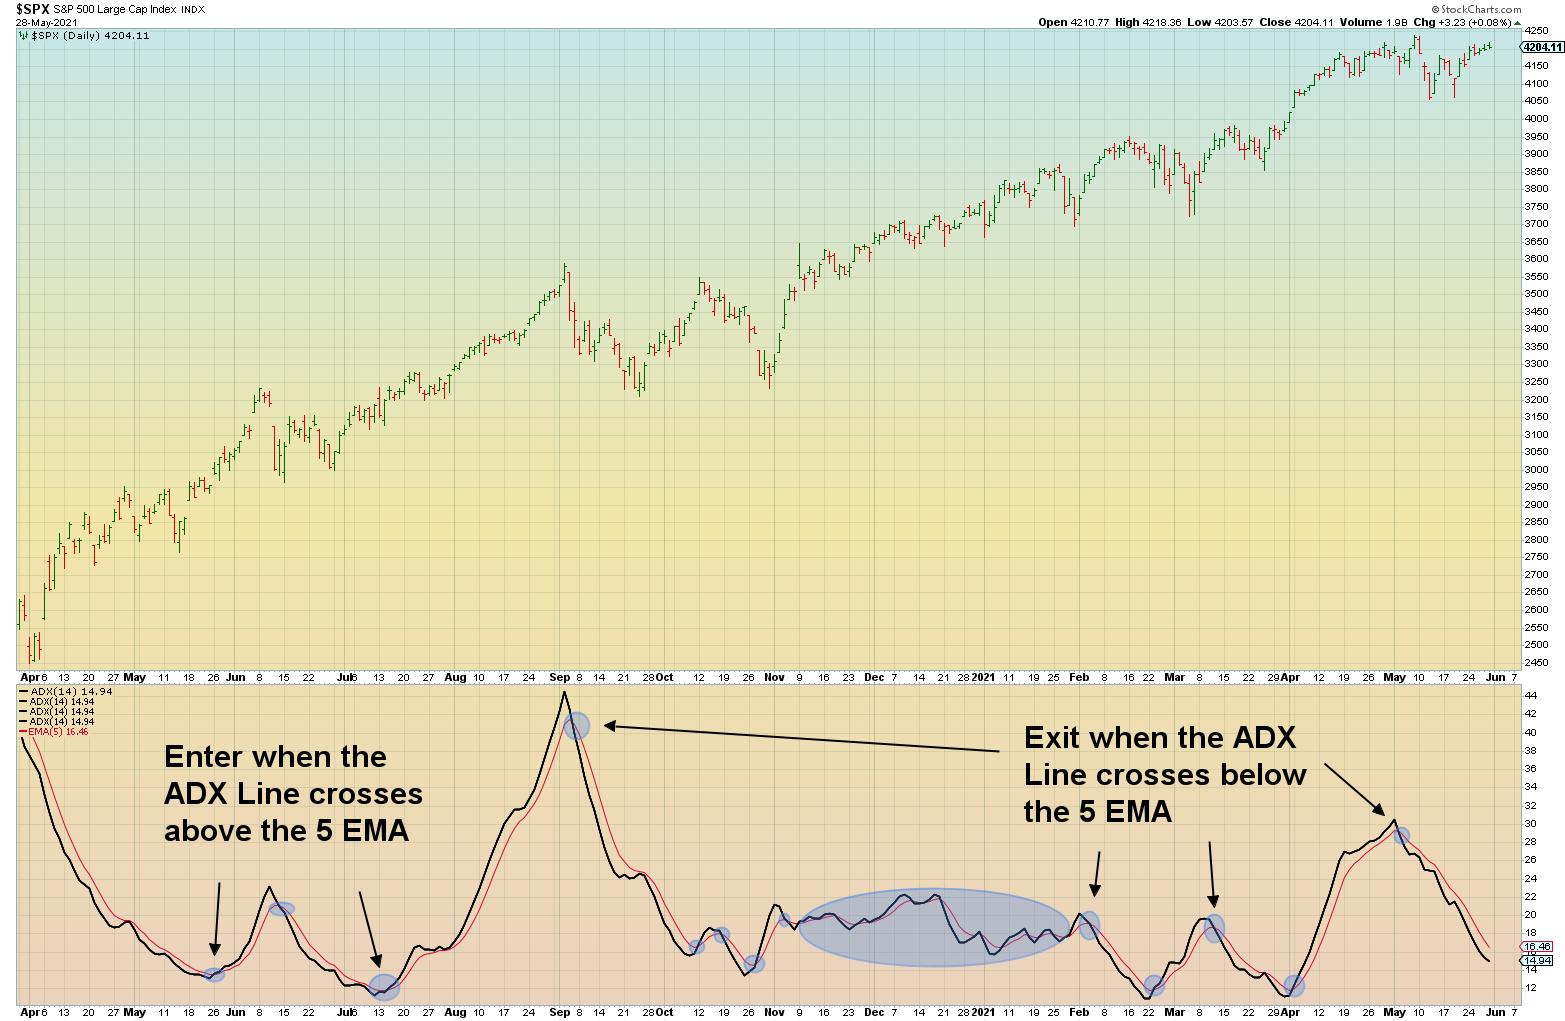
Additional rules can be applied that allow for a more flexible and dynamic focus, rather than basing decisions on a static number such as 20 (25 is also used).
- A 5-period Exponential Moving Average (EMA) is plotted on the ADX.
- When the ADX Line crosses above the 5 EMA, a trend is beginning or strengthening.
- When the ADX Line crosses below the 5 EMA, the trend is starting to end or is weakening.
Implementation 3
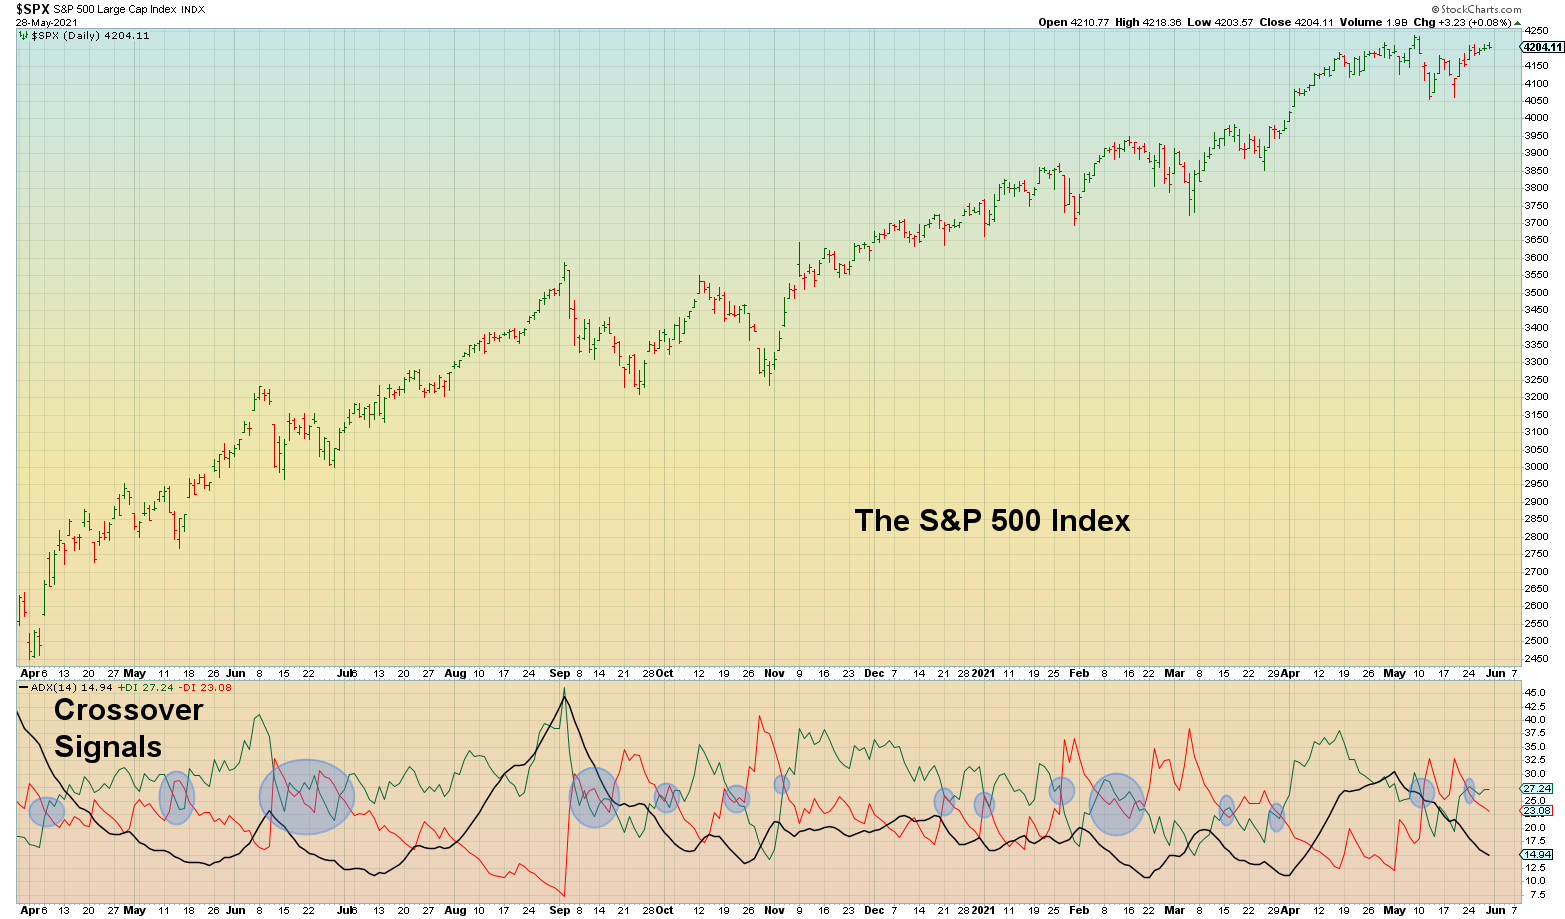
The ADX Line is based on two other lines called +DI and -DI. The +DI (up) and -DI (down) calculations measure trend direction. These lines can be plotted and used as triggers when the lines cross.
- Look to enter or exit when the +DI (green) and -DI (red) lines cross.
- Long positions are initiated when the signals suggest an uptrend.
- Short positions are initiated when the signals suggest a downtrend.
Implementation 4

The full ADX Average Directional Movement Indicator is plotted.
- Enter long positions when the +DI crosses above the -DI line AND the ADX is moving higher.
- Enter short positions or exit long positions when the -DI crosses above the +DI line, AND the ADX is moving lower.
It is tempting to conclude that applying all three calculations together would generate the best signals. In reality, very few, if any, signals are generated.
Drawbacks of using the full ADX Average Directional Movement Indicator
It may be necessary to use “vicinity signals,” such as going long when the ADX Line turns up and the +DI (up) is above the -DI (down) soon after. Determining which signal triggers first (ADX, +DI, or -DI) and which signal is used for confirmation, as well as the length of time between signals, will need to be determined individually by each market participant. It should also be noted that while implementing vicinity signals may be desired, personal interpretation, which can be prudent and is strongly supported, opens the door for emotions and subjectivity, which can cloud judgment.
Advantages of using the full ADX Indicator
The full ADX Indicator is still useful when implementing sideways strategies. For example, rather than implementing complete market-neutral positions, bias-based positions can be implemented that are in the least amount of danger of needing to be adjusted or may cause a loss.
The BEST Implementation
The biggest challenge is figuring out which implementation is best. There are strengths and weaknesses with all four implementations. Refinement, as well as combining all analysis with other TA tools, is good practice. A prudent approach involves daily analysis of each implementation within the context of the current market environment.
Conclusion
As with any TA indicator, back-testing and forward testing should be done before live implementation of the ADX. Once confidence is attained, the ADX can be used to help make better decisions. However, no indicator is perfect. A personalized method should be developed based on style, time frame, risk tolerance, and objectives. Although the ADX Indicator can become an important analysis tool, no indicator should ever be used in isolation. There are methods taught that implement trading systems based on one or two indicators. However, experience shows that such practices should be avoided if they do not fit your personality.
