Two Types of Technical Analysis Indicators
Download (Login required) Audio PDF
Technical Analysis (TA) can be a potent tool in the stock market. As with any tool, proper knowledge is required for successful operation. In the wrong hands or implemented in the wrong way, TA can lead to disaster. Think of TA as a car. A car is neither good nor evil. It is a-moral. However, a vehicle can be used in positive ways, but it can also be used as a weapon.
The stock market and Technical Analysis (TA) are similar. Prices going up or down is not good or bad. The stock market is not “out to get you,” and it does not “owe you anything.” Millions of participants are active each day, and each is trying to do the same thing: make money. How others do this may contradict the method you use. We can quickly feel that the odds are stacked against us or that we are entitled to a profit. We try to control things but promptly realize the stock market cannot be controlled. It is its own beast.
For assistance, tools are implemented to help us see and understand what is happening and what we should do. TA can be a good tool and become the backbone of your decision-making processes if appropriately used. However, this can take time to learn.
I have developed a unique method of Technical Analysis (TA) called The Consensus Approach. It is unique in that it takes into account my personality, style, and goals. Many have found this beneficial for them, so I teach The Consensus Approach to others.
What makes The Consensus Approach innovative is that, instead of relying on a few indicators, an entire spectrum of available indicators is considered to reach a general conclusion about future price movements. This method has been very effective and accurate. It allows for the development of foresight instead of constantly relying on hindsight. However, it is a skill that has been developed over decades of experience. In my program, my goal is to help others develop the same skill and apply it to their own personality, style, and goals.
Technical Analysis (TA), as a discipline, is a visually-based systematic method for attempting to determine the future movement of an index, stock, mutual fund, bond, or any tradeable security. TA uses historical data in the form of charts for analysis. TA is used to help determine WHEN to enter or exit.
TA is one only discipline, and many only depend on this approach. However, a better process involves including other disciplines such as Fundamental Analysis (FA) and Mental Analysis (MA). For a more in-depth explanation of all three methods, please click here.
Although visually based, TA calculates numbers that can be analyzed. This includes scans that take a large amount of data and return only those stocks that meet specific criteria. Conversely, when index investing, no scans are necessary since there is no need to select individual stocks.
Technical Analysis Indicators
Technical Analysis (TA) uses indicators, which are mathematical calculations based on price, volume, or both using historical data. Calculations can be plotted on a chart, in addition to prices, for visual references. Indicators can be used to determine current market conditions, as well as predict future price movement. As useful as indicators can be, there is no holy grail indicator. Investors usually implement their favorites which are often learned from others. Indicators can be beneficial and accurate, but nothing is 100% correct each time. What works one time may not work for another time. False signals can and do often occur.
There are thousands of Technical Analysis (TA) indicators available. Some traders invent their own. The goal is to find the “end all’ indicator that leads to the “promised land of unending success.” Unique insight is desired that is flawless and signals the exact times to enter or exit. Despite countless hours spent trying to find such tools, the journey is never-ending. Good TA indicators do exist, but there are limitations. That was one rationale behind developing The Consensus Approach.
Categories of Indicators
TA Indicators fall into two main categories. They are Moving Averages and Oscillators.
- Moving Averages
Moving Averages are the most common and most popular indicators used in Technical Analysis (TA). A Moving Average is calculated when prices are added together and then divided by the number of periods to get an average price. The next period will see the current period added to the calculation and the first period dropped off. Over a period of time, a line is drawn that shows a smoothed average of prices, yielding valuable information. The direction of the line, the relation of the line to the current price, as well as one Moving Average in regard to another Moving Average can provide helpful insight.
Moving Averages can be calculated in slightly different manners. A Simple Moving Average (SMA) gives all periods the same weight or level of importance. However, some feel the first periods used should not be as crucial as more recent periods. In which case, each number is weighted to reflect prices closer to the current price. Weighted Moving Averages and Exponential Moving Averages are popular with many market participants. MAs are usually placed on top of prices for context.
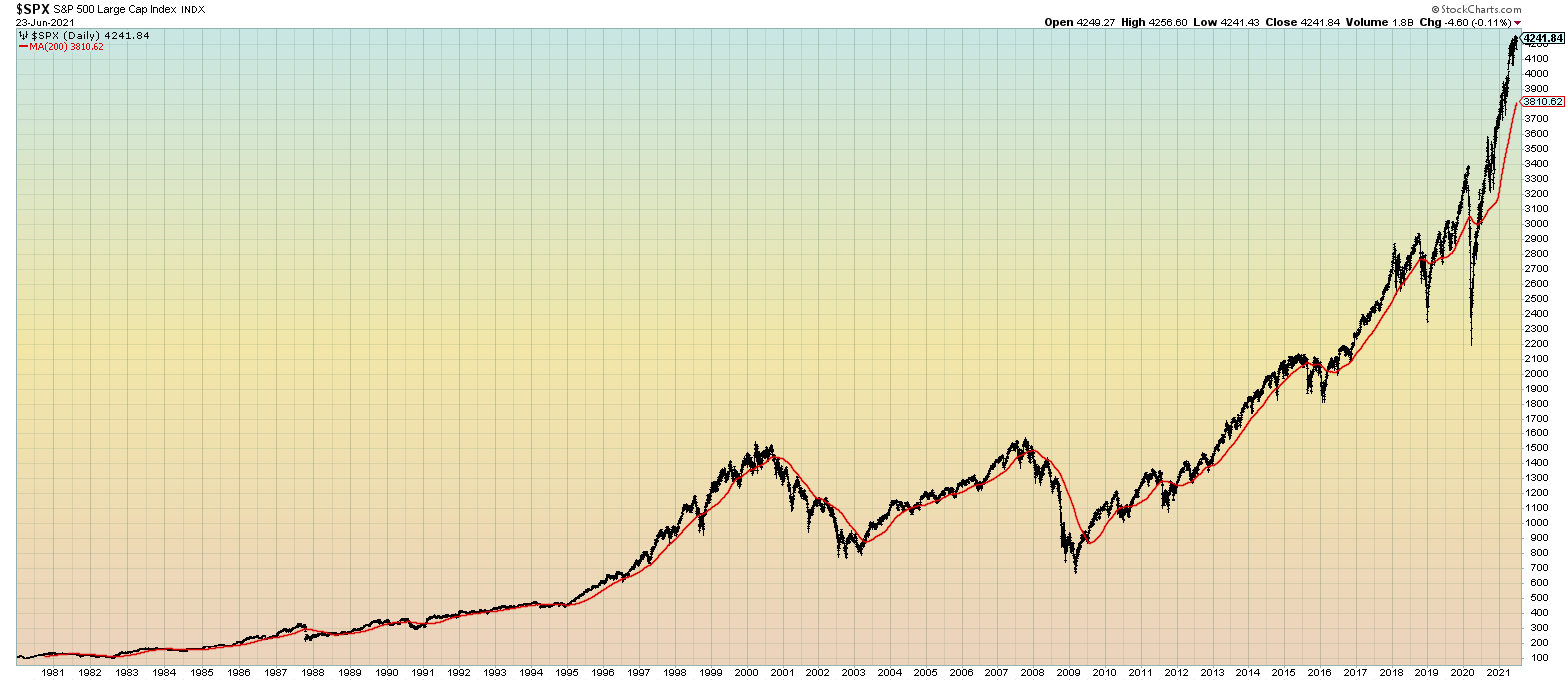
The chart below is the S&P500 Index going back to 1980 with a plotted 200 Simple Moving Average.
The chart below is the S&P500 Index going back one year with a plotted 200 Simple Moving Average.

Characteristics of Moving Averages
- Longer MAs move slower than shorter MAs. A 50 SMA will move faster than a 200 SMA since there are fewer prices to calculate. This allows recent prices to have more impact on a shorter MA.
- Moving Averages are lagging indicators since they are derived from historical prices. It can take time for moving averages to respond to current price action.
- MA analysis includes studying the direction of the MA line. If the line is moving up or down is helpful information. An advancing line is positive, whereas a declining line is negative. Also, the relation to price is studied. If prices are above the MA, this is positive while below is negative.
- Moving Averages will often act as a magnet. If prices get too far away from an MA, the natural tendency is for prices to move back or revert to the mean.
- MAs are valuable for finding Support and Resistance levels.
- Support occurs when prices fall, and selling pressure is exhausted at a specific price or price range. This level is met by buyers who enter new positions and/or short-sellers who close existing positions. Prices often bounce, which can be a short-term move or lead to a continuation of declining prices.
- Resistance occurs when prices rise and buying enthusiasm is exhausted at a specific price or price range. This level is met by sellers who exit existing positions and/or short-sellers who open new positions. Prices often retreat, which can be a short-term move or lead to a continuation of rising prices.
The chart below is the S&P500 Index going back to 1980 with 50 and 200 Simple Moving Averages plotted.

The chart below is the S&P500 Index going back one year with 50 and 200 Simple Moving Averages plotted.

Moving Average Time Frames
Any time frame can be used to calculate an MA. There is no magical number. Traders will often study MA time frames to see what would have worked best in the past. This should be avoided since it can lead to a false sense of confidence created by form-fitting MA lengths.
In a very general way, timeframes are typically defined as:
10 periods or less: short-term
50 periods: intermediate-term
200 periods: long-term
Calculation of Prices
MAs can be calculated based on the:
Open
High
Low
Close, which is the most common.
MA Variations
- Studies have been developed that are based on MAs. One variation is Bollinger Bands®, developed by John Bollinger and explained in his book “Bollinger on Bollinger Bands.”
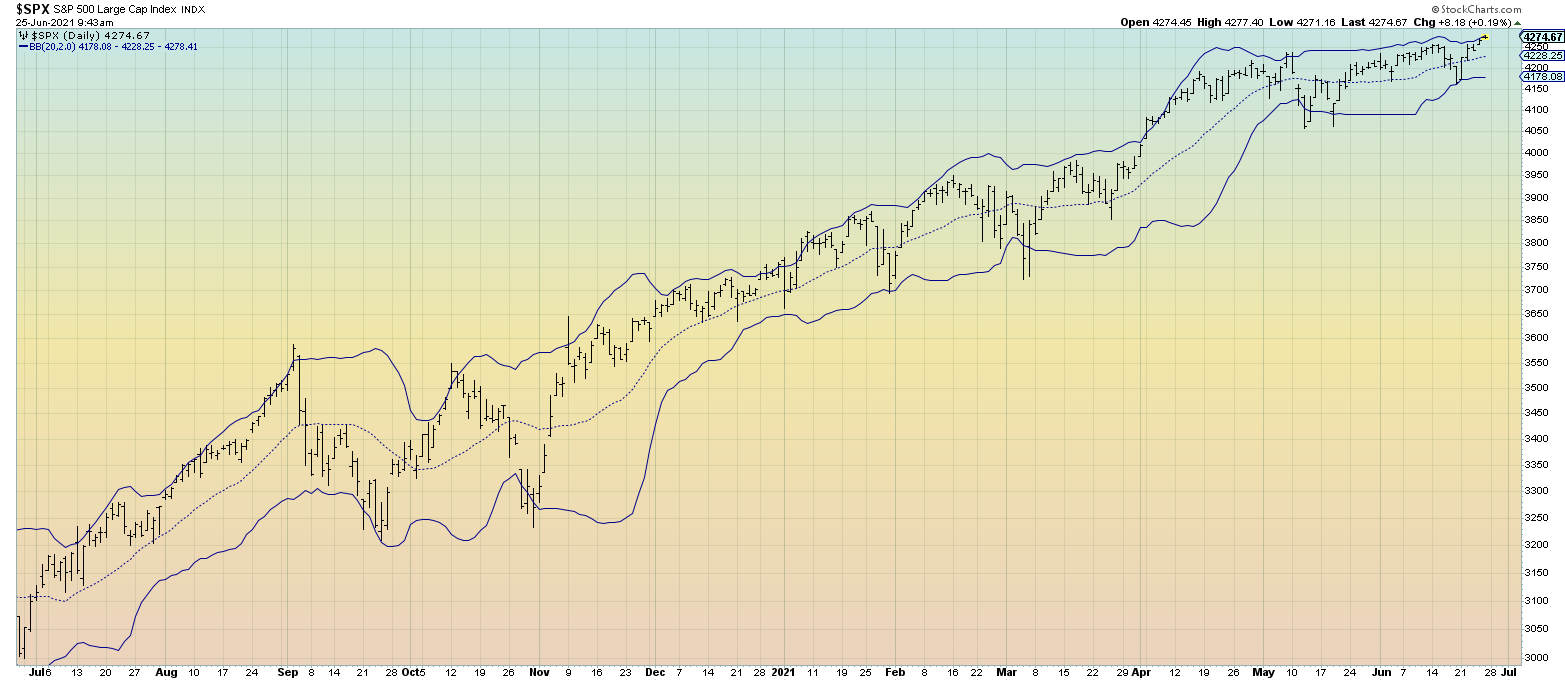
The chart below is the S&P500 Index going back to 5 Years with Bollinger Bands plotted.

The chart below is the S&P500 Index going back to 1 Year with Bollinger Bands plotted.
Bollinger Bands book
- The MACD (pronounced MACK-Dee) is also based on moving averages. This is likely the most famous indicator in existence. It is common for those new to TA to learn this indicator first.
The chart below is the S&P500 Index going back to 5 Years with the MACD plotted. Please note that although the MACD is based on Moving Averages, it is usually plotted in a separate window.
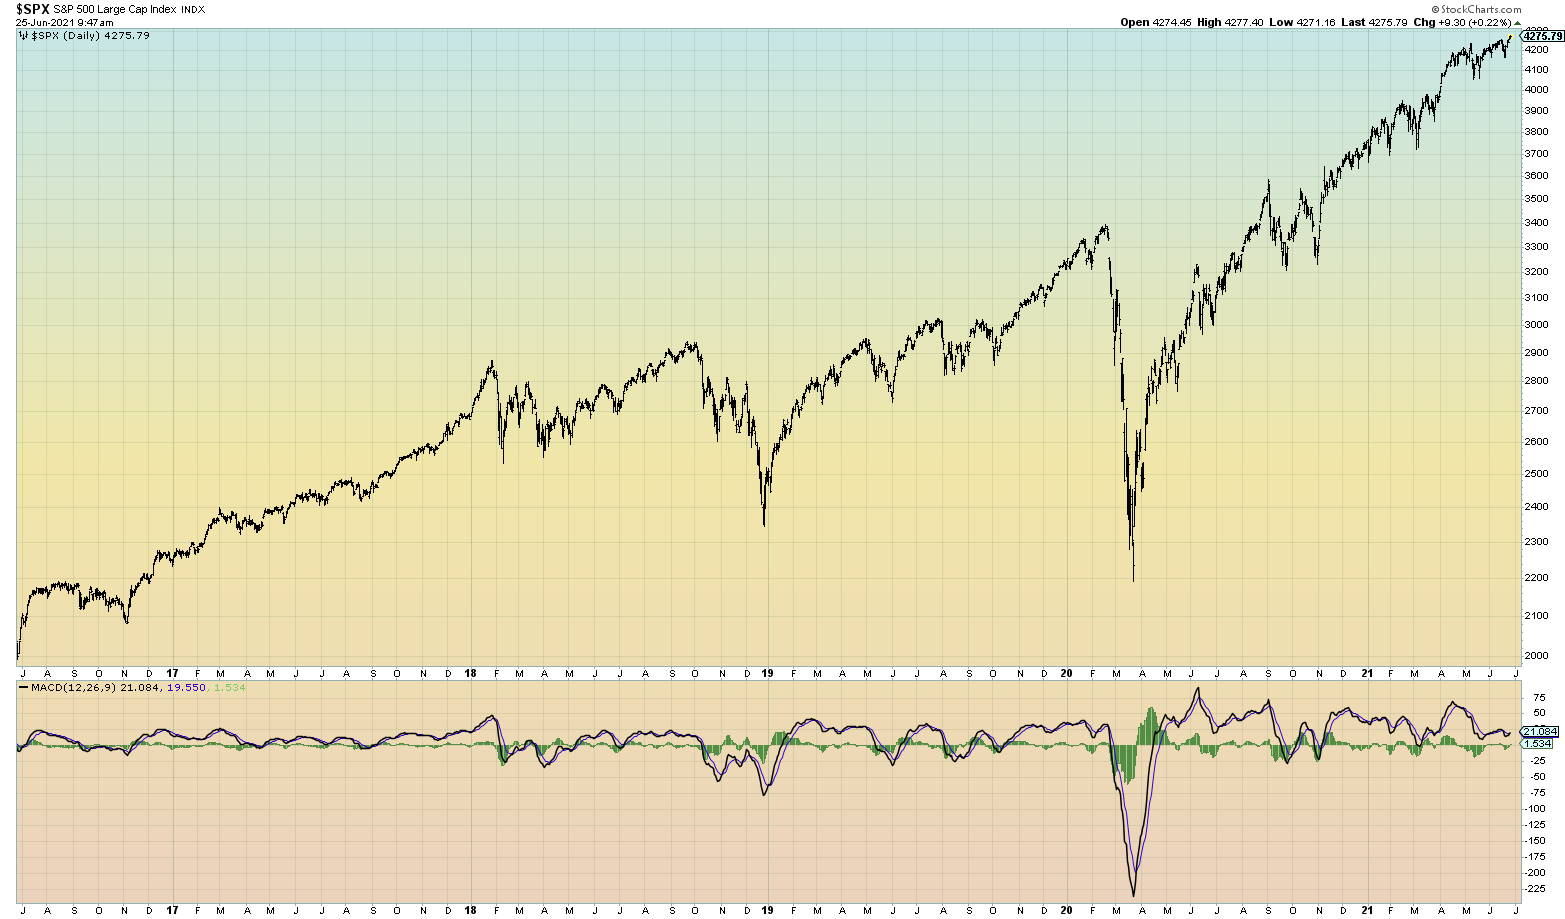
The chart below is the S&P500 Index going back to 1 Year with the MACD plotted. Please note that although the MACD is based on Moving Averages, it is usually plotted in a separate window.

- Please note that the examples provided are not explained in this discussion. They are only shown as examples. For more in-depth explanations of these indicators, please click here.
- Oscillators
Oscillators measure Momentum, as well as trends.
Momentum is a short-term movement that can last as little as one day or last for several days. The length of time is fluid and can change often. Basically, if a stock has a down day, the Momentum is negative. If a stock had an up day, the Momentum is positive. An unchanged day would not necessarily see a change in Momentum.
Quite often, Momentum and Trend (discussed next) will contradict each other. For example, a trend may be up, but the Momentum may be down. If Momentum continues, it will eventually develop into a trend.
Trends are the longer-term movements of prices. The term “longer” gets its context when compared to Momentum. Each day comes and goes and, in some ways, exists in a vacuum, which is measured by Momentum. When taken together, Momentum becomes a trend or, stated differently, the larger context of prices moving up or down.
Trends can last a few days in choppy environments or last for weeks, months, and even years. It is best never to fight against the trend. If the trend is positive, long positions (up) should be initiated. If the trend is negative, short positions (down) should be initiated, or long positions should be exited. Not all investors “go short.” Instead, it may be desirable to get out of long positions and wait until a new uptrend starts.
The idea is to start with the shortest time period, in this case, one day, and build a broader view of price movements. Next, 2-5 days are observed, followed by weeks, months, and years. This has been a successful approach and provides a larger context.
Overbought (OB) and Oversold (OS)
Overbought (OB) occurs when prices have risen too far too fast. There are numerous reasons why this can happen. Think of it as an overreaction as prices shoot higher quickly and become unjustifiably overpriced. Short-term traders seeking small profits are happy and sell to exit a position. This causes prices to fall back to a more “normal” range.
Oversold (OS) is the opposite of Overbought (OB). Prices have fallen too far too fast and are often due for a bounce. This usually occurs during significant downtrends that are almost finished, which is often called a crash. Also, when the stock market is caught by surprise, this can be seen as negative, resulting in prices falling quickly. Many investors will “sell now and ask questions later.”
Please understand that Overbought (OS) and Oversold (OS) conditions can last for days, weeks, or even months. Although this will often be more prevalent when prices rise and become overbought (OB), oversold conditions can last for extended periods and are usually met with buying action as the intense selling stops. This is typically viewed as “bargain hunting.”
Just because an OB/OS condition occurs does not mean a turn is imminent. There can be a delay until an official signal is given. Most OB/OS indicators must reverse and drop below defined numerical level before an official signal is generated.
OB/OS conditions often confirm a price move. Prices were moving in the right direction but just went too fast. Once price movement settles down, a resumption of the move may continue. Other times, a reversal may occur. Some participants are reluctant to open new positions when conditions are in OB/OS territory. Others are not concerned with this and see it as a healthy confirmation.
Note. There are entire trading systems based on the concept of capturing OB pullbacks, or OS bounces by entering a position that goes against the more significant trend. This is a common tactic of day-traders looking for very short-term moves that can be entered and exited within the trading day. Although logical and can be reasonably successful, I have found that this strategy should be ignored. Day-trading may sound appealing and even tempting. I have tried it many times and in many markets. Unless you like the idea of being tied to a computer all day, going to chat rooms to hear hilarious and misleading advice, and don’t mind suffering health problems quickly, this type of trading should be avoided at all costs. I do not teach day trading. This is only my opinion and not a fact, but it is an opinion I have developed over many years through personal experience.
Oscillators are constructed to move in a range, such as 0-100. Within the range, extreme values are defined. This can include prices climbing above the upward band, which is called Overbought (OB) territory. Declining prices enter the lower band and are in Oversold (OS) territory.
Typically, Oscillators are more sensitive to short-term price movement than Moving Averages.
Popular Oscillators
The most common oscillators are the:
Stochastic Oscillator
The chart below is the S&P500 Index going back to 5 Years with the Stochastic (Stoe-cass-tick) Oscillator plotted. Please note that Oscillators are plotted in a separate window.

The chart below is the S&P500 Index going back 1 Year with the Stochastic (Stoe-cass-tick) Oscillator plotted. Please note that Oscillators are plotted in a separate window.

Relative Strength Index (RSI)
The chart below is the S&P500 Index going back 5 Years with the Relative Strength Index (RSI) Oscillator plotted. Please note that Oscillators are plotted in a separate window.

The chart below is the S&P500 Index going back 1 Year with the Relative Strength Index (RSI) Oscillator plotted. Please note that Oscillators are plotted in a separate window. Also, note the annotations showing official Overbought (OB) signals.

Rate of Change (ROC)
The chart below is the S&P500 Index going back 5 Years with the Rate of Change (ROC) Oscillator plotted. Please note that Oscillators are plotted in a separate window.
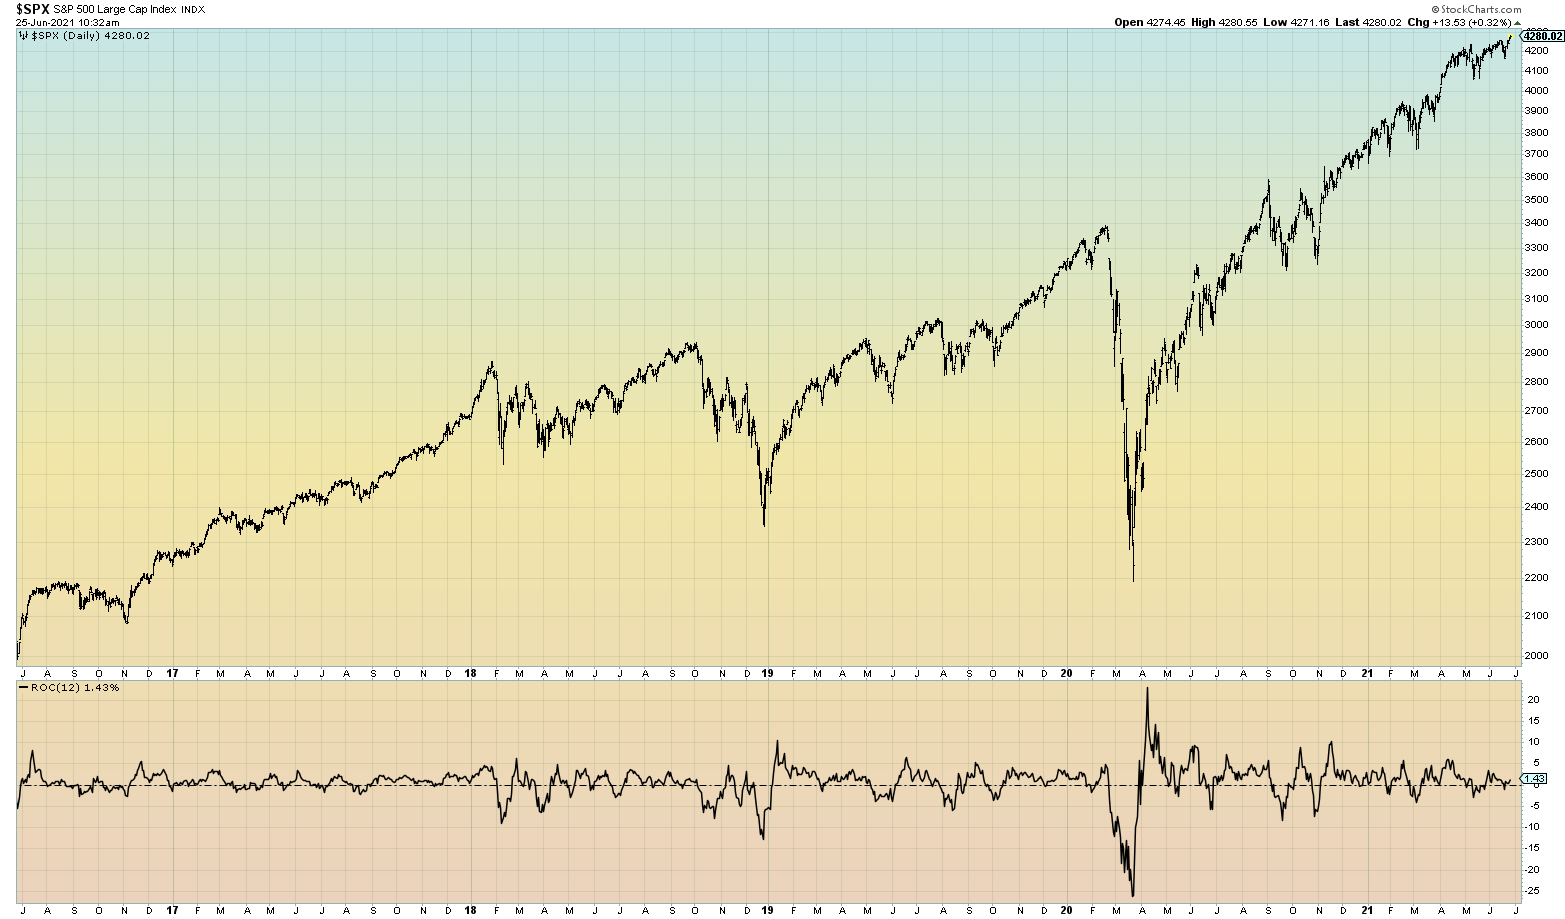
The chart below is the S&P500 Index going back 1 Year with the Rate of Change (ROC) Oscillator plotted. Please note that Oscillators are plotted in a separate window.

Money Flow Index (MFI)
The chart below is the S&P500 Index going back 5 Years with the Money Flow Index (MFI) Oscillator plotted. Please note that the Oscillators are plotted in a separate window.

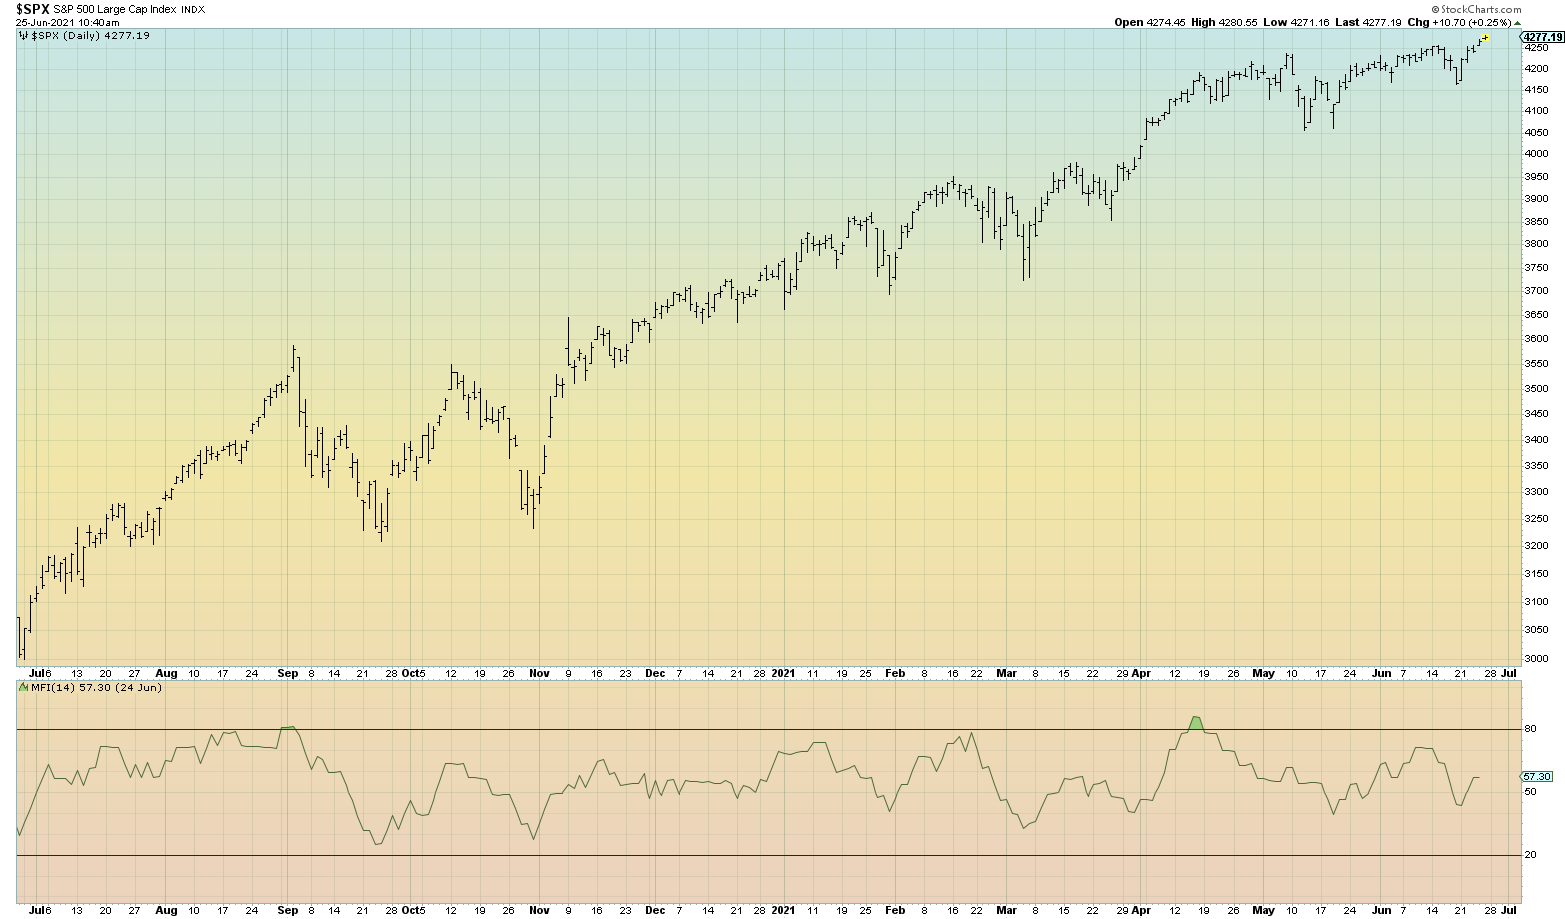
The chart below is the S&P500 Index going back 1 Year with the Money Flow Index (MFI) Oscillator plotted. Please note that the Oscillators are plotted in a separate window.
Please note, as with MA Indicators, the following Oscillator examples are not explained in this discussion. They are only shown as examples. For more in-depth explanations of these indicators, please click here.
The general idea is for Oscillators to measure Momentum and Moving Averages to measure the trend.
Useful Websites
The list below is only suggestions and is not exhaustive.
Stockcharts.com: An excellent TA website. The charts I use for articles come from this site.
SPXInvesting.com (my website, currently offline and being rebuilt)
Metastock: A very good TA Application and how I learned TA.
Thinkorswim: A monster piece of software that is free but has a steep learning curve.
Tastyworks: Also, a monster piece of software that is free. It is excellent for all markets. However, it is best suited for options traders.
Most brokerage accounts have access to TA tools.
Technical Analysis Books
Numerous books cover TA. Some are good, some are bad, and some are just OK. However, most books end up saying the same things over and over. One of the most popular books on Technical Analysis is Technical Analysis of the Financial Markets by John J. Murphy. Although a bit outdated, it can be a helpful tool. Amazon Link

On a personal level, my early TA foundation was laid by the book “Technical Analysis from A to Z” by Steven Achelis, the founder of Equis International and the creator of the TA software application Metastock. Amazon Link
It is essential to have access to TA software when learning Technical Analysis. For many years, I used Metastock, but in the last decade, I have switched to stockcharts.com.
Conclusion
Technical Analysis can be a powerful tool that serves as the primary foundation for an investing or trading program. When properly implemented, valuable insight can be gained for making decisions and understanding context. There are two main types of Technical Analysis Indicators; 1. Moving Averages, and 2. Oscillators. There are many variables and different implementations of each type of indicator. Generally, an Oscillator measures Momentum, and Moving Averages measure the trend. When combined, market participants can be given a good view of current conditions and project possible future price movements. There are many indicators available, and each individual must determine which ones serve them best. An alternative approach, called The Consensus Approach, was developed to use a different method of interpretation rather than relying on only a few indicators. There are excellent information sources online and books that each market participant may consider adding to their information library.
