What are Financial Market Indexes?
Download (Login required) Audio PDF
Numerous indexes can be followed. The idea of an index is to serve as a benchmark to measure how the different financial markets, stock markets, sectors, industry groups, etc., are doing as a whole. The nice thing is that indexes have become popular, so investing in an index rather than individual stocks is possible. This can be advantageous, and strengths built-in to an index can be carried over into an investment.
Indexes or Indices?
First of all, there is a debate. Do we say “Indexes” or “Indices?” Either term is correct, and they have become interchangeable. In the UK, the term “indices” is most prevalent, while in the US, “indexes” is most often used. Both are considered correct. I usually use the word “indexes.”
Definitions
Types of Charts
- Intraday charts are viewed while the market is open. There can be many different time frames to follow, such as charts that are 1-minute, 5-minute, 10-minute, 30-minute, etc. Each person will have their favorite. Personally, I have found the 10-minute intraday charts to provide the best insight.
- I will plot Pivot-Points, which are pre-calculated levels of support and resistance. It is incredible how accurate Pivot-Points can be.
The chart below is a 10-minute chart of the SPX with Pivot Points plotted.

- Daily charts are mandatory for Technical Analysis (TA). Each bar is one day. One bar will display the Open, High, Low, and Close.
The chart below is a daily bar chart of Microsoft (MSFT)

The chart below is a daily line chart of the Vanguard 500 Index Fund Admiral Shares

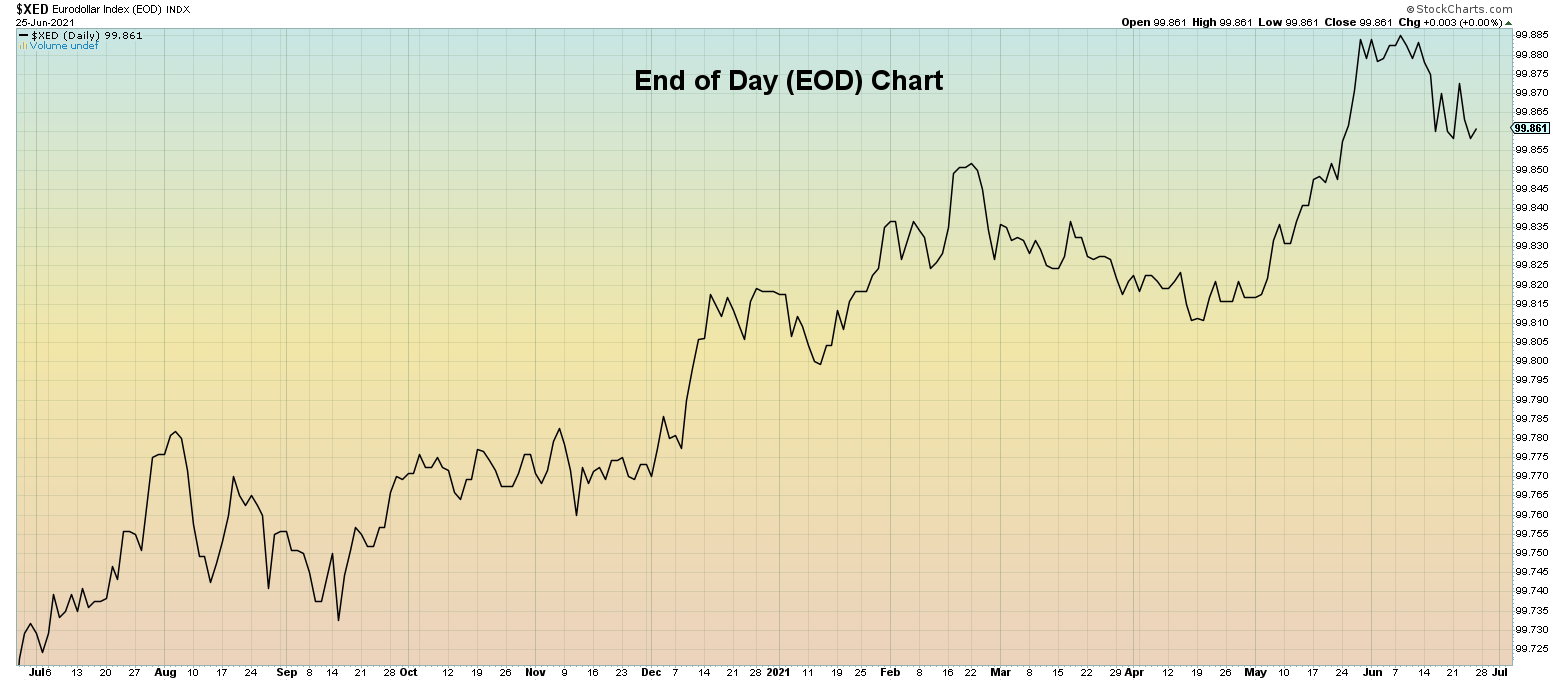
- EOD (End of Day) charts are updated after the market closes and will often be a line chart. EOD charts are good for Intermarket Analysis in which other markets are studied to see how the stock market may be impacted.
The chart below is an End of Day (EOD) chart of the Euro
- ETF charts can be pretty helpful and have become popular measurement tools since the ETF universe has become very extensive. An ETF may replace an index since the goal is for an ETF to have a 1:1 relationship with an index. Also, ETFs have volume displayed, while an index may not report volume.
- Studying volume is beneficial. Volume studies and analysis provide helpful insight. Studies and analyses such as the average daily volume and volume levels during significant moves can yield profiting information. Price is king and must be followed. However, volume is queen and often dictates what price action might do.
The chart below is a daily chart of the SLV ETF, which correlates to the price of silver.

Background
Until the late 1800s, the stock market’s current condition was known only by what stocks an investor owned. In the late 1880s, Charles Dow created a hypothetical index of the most important American companies at that time. He started with railroad stocks. This would lead to the Dow Jones Industrial Average, which is the most cited index today.
Which Indexes are best?
Today, there are over 5,000 indexes for US markets.
Market participants will find an index they like, and that often becomes an index of focus. It is common to follow the most popular indexes. This allows us to watch what others are watching simultaneously.
The Consensus Approach
Using multiple indexes fits nicely into The Consensus Approach implemented by The SPX Investing Program. The idea is to figure out current conditions and likely future moves. Additionally, we try to figure out what the Smart Money is doing and copy what they do.
Indexes
Indexes can represent a broad or narrow segment of the financial markets. Some indexes focus on world stocks, country stocks, sectors, industry groups, and various regions. Calculations are made based on the stock values that make up an index.
Most indexes are weighted according to the size of the company, but different weighting methodologies are used. Some indexes are price-weighted while others are value-weighted.
Investors don’t directly invest in an index but use them as broad-based benchmarks and for developing index mutual funds and ETFs.
Price-weighted Index
The DOW is a price-weighted index. It is made up of 30 stocks. One big stock may be down while the 29 others are up, so that the DOW might be down overall. Prices can be skewed. For this reason, the DOW is not necessarily a good representation of the entire stock market. Yet, it is the index most reported in the financial media, and the one people are the most familiar with following.
The chart below is of the DOW

Value-weighted Index
The S&P 500 (SPX) is a value-weighted index. This is based on the number of shares of each stock. Many feel this is a much better representation of the stock market for two reasons:
- There are more stocks. The SPX has 505 stocks instead of 30 stocks in the DOW.
- The calculation method gives greater insight.
The chart below is the S&P500 (SPX)

Unweighted Index
All stock values and share numbers are treated the same. Each stock has just as much impact on the index value as any other. These are called unweighted indexes. For example, there is an Equal-Weight index of the S&P500. This can be useful when compared to the S&P500 to see if all stocks are moving up, down or if a significant move is mainly due to a few stocks.
The chart below is the S&P500 Equal Weight Index ($SPXEW)

The chart below represents the S&P500 and Unweighted S&P500 plotted together for comparison.

Most Popular US Indexes
Stock Market Indexes:
- The Dow Jones Industrial Average (DJX) is the most famous and most followed index.
Below is a chart of the Dow Jones Industrial Average
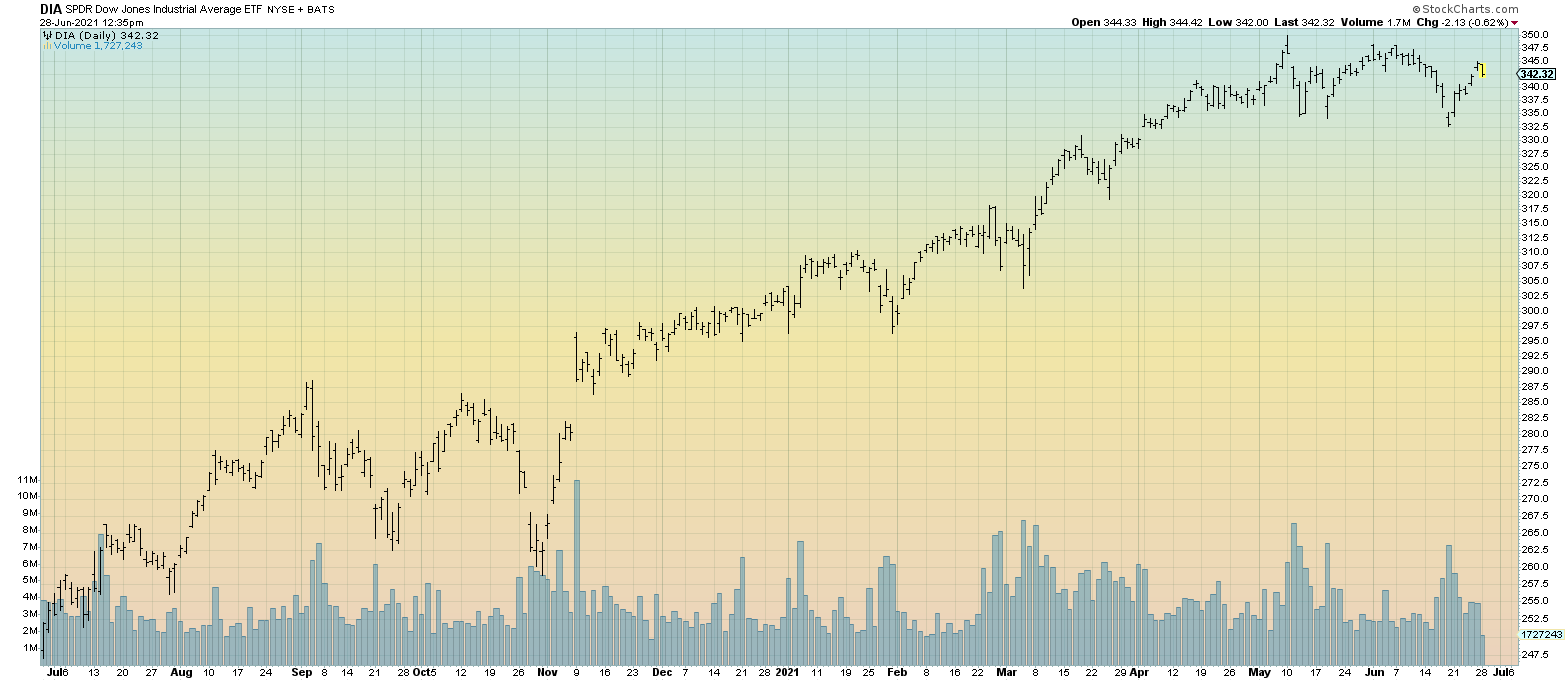
An ETF of the DOW called the Diamonds (DIA) can be bought or sold like a stock. There are also DOW-based mutual funds.
Below is a chart of the Diamonds (DIA) ETF based on the DOW.
- The S&P 500 Index (SPX) is not quite as famous. Currently, the SPX has 505 stocks. The most popular ETF, the SPDRs (SPY), can be bought and sold as well as S&P500 mutual funds.
Below is a chart of the SPDRs (SPY) ETF based on the S&P500.

- The Nasdaq Composite Index (COMPQ) currently has about 2,667 stocks. The number often changes as new stocks are added, old stocks are taken over by other companies, or they go out of business.
Below is a chart of the NASDAQ Composite

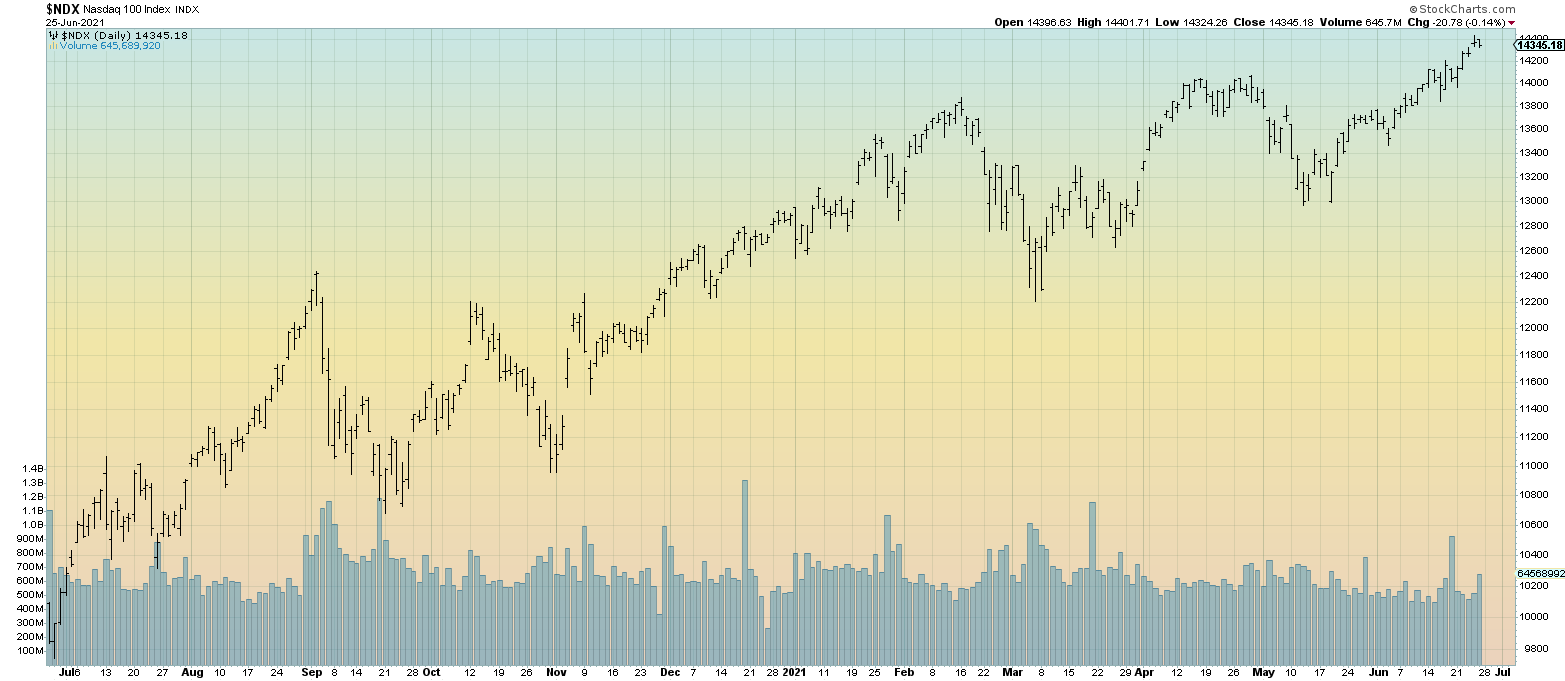
The Nasdaq 100 Index (NDX) measures the 100 largest companies on the NASDAQ. Currently, there are 102 stocks in the index. This includes famous names such as Microsoft (MSFT), Starbucks (SBUX), Intel (INTC), Apple (AAPL), and Google (GOOGL and GOOG).
Below is a chart of the NASDAQ 100 (NDX)
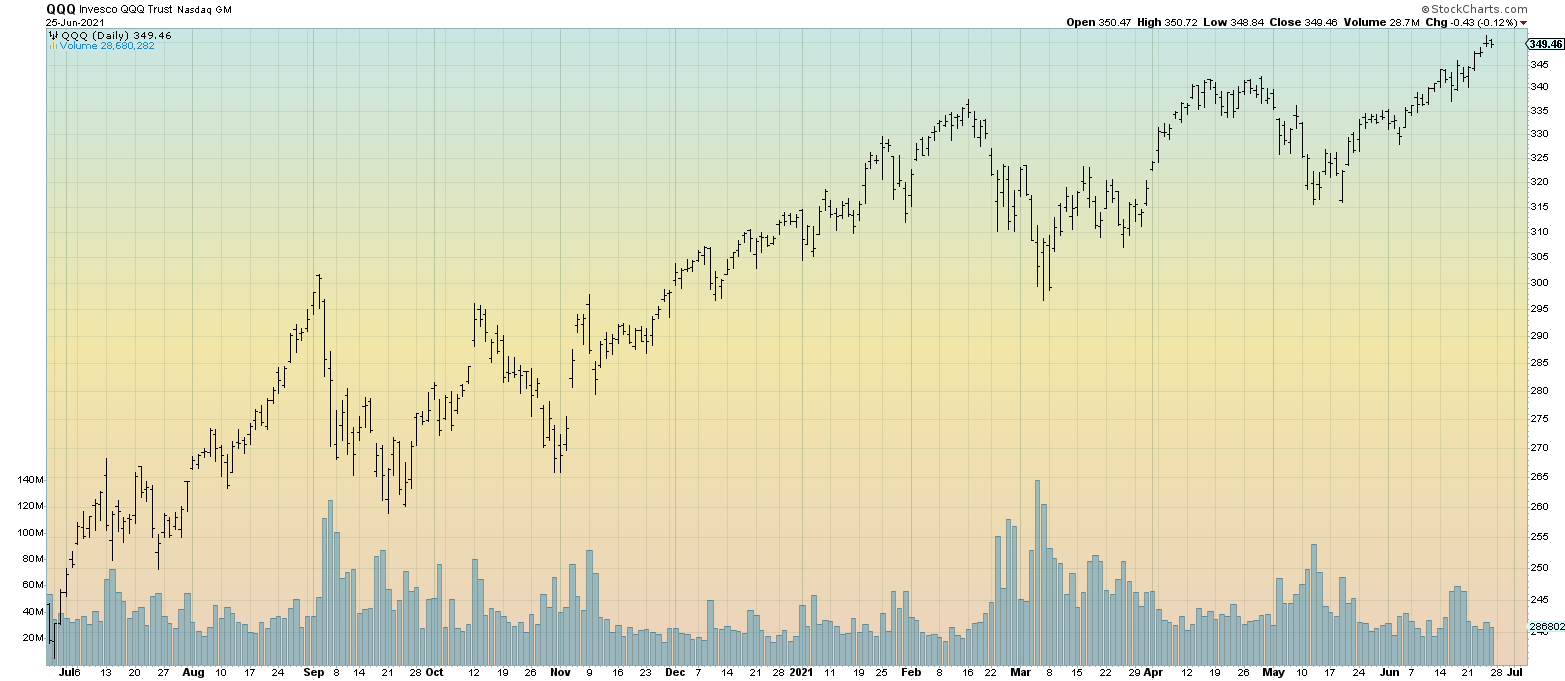
There is a very popular ETF that is connected to the NDX called the QQQ, as well as NASDAQ 100 mutual funds.
Below is a chart of the NASDAQ 100 (QQQ) ETF
Bond Market Indexes:
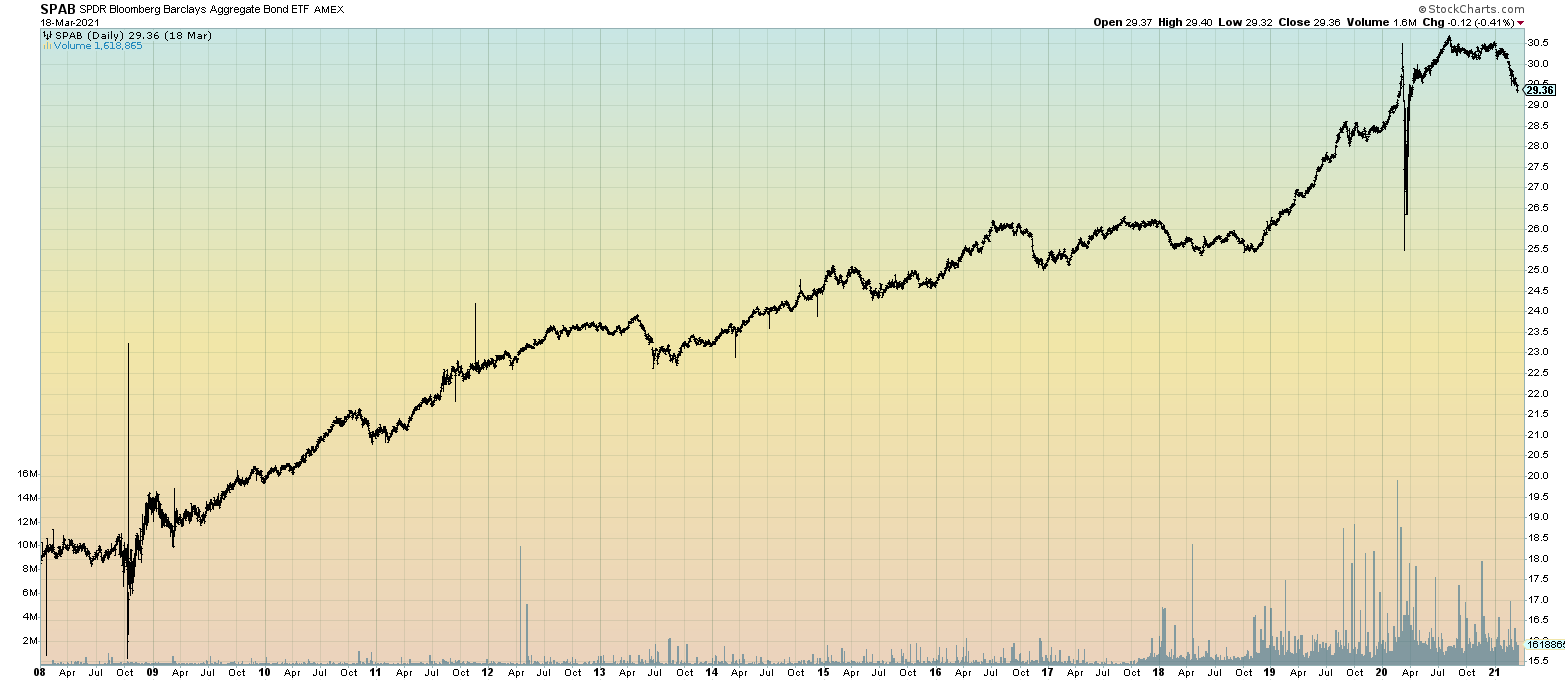
- Bloomberg Barclays U.S. Aggregate Bond Index ETF is beneficial for tracking bond prices. Other bond indexes are usually based on the maturity of the bonds.
Corporate bonds are also popular. Most famous bonds are issued by the US Government. However, private companies that issue bonds are substantial.
Below is a chart of the corporate bond index

Below is a chart of the World Bond Index

Additional Popular US Indexes
Small-Cap Indexes
Russell 2000
S&P 600
Below is a chart of the S&P600 ($SML) Small Cap Index

Mid-Cap Index
S&P 400
Below is a chart of the S&P400 ($MID) Mid Cap Index

Other markets
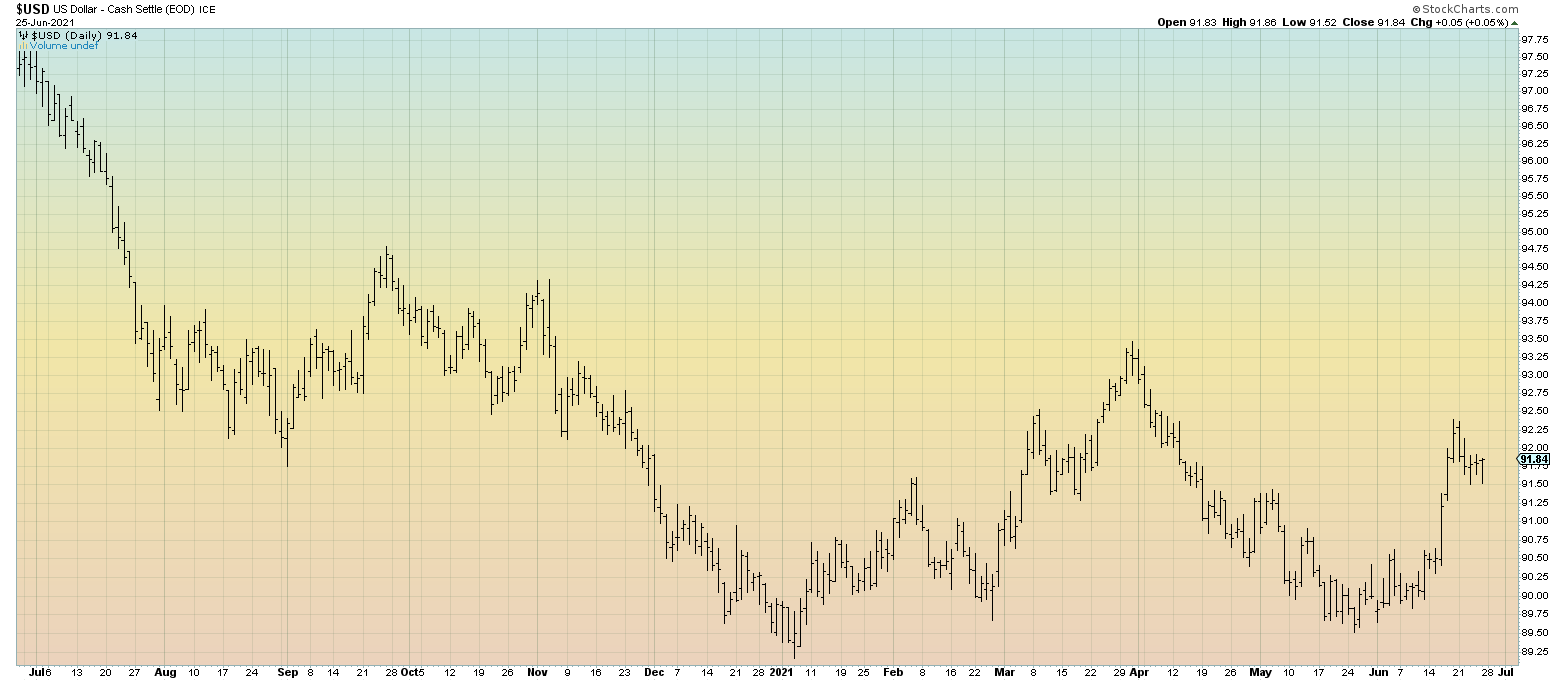
US Dollar Index (DXY) ($USD)
Below is a chart of the US Dollar Index
Gold (GLD)
Below is a chart of the continuous gold futures contract

Below is a chart of the gold ETF (GLD)
 Oil ($WTIC)
Below is a chart of the oil index. Currently, an ETF is not followed due to problems in spring 2020 when oil went negative.

FAANG Index: Facebook, Amazon, Apple, Netflix, Google
The chart below is an index of FAANG stocks

Volatility Index: $VIX. The Fear gauge.
Below is a chart of the VIX

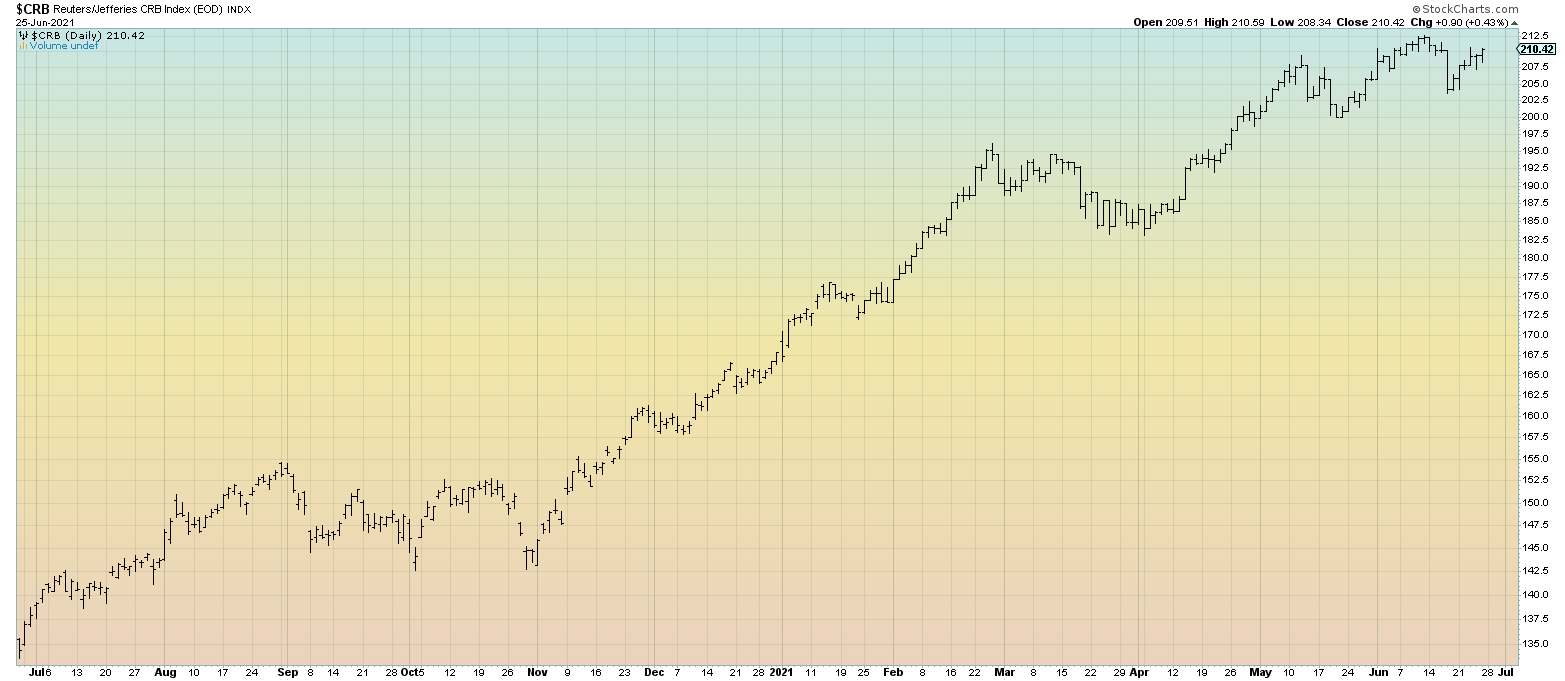
The CRB Index measures a basket of commodities. This is helpful for watching for signs of inflation.
Below is a chart of the CRB Index
Index Calculations & Uses
Each index is calculated differently. Some indexes are calculated simply, and others are complex. The index creator will specify the method and rationale of the method.
Investors and money managers use indexes to base performance. The goal is to “beat the market.” Most managers are not successful, at least consistently. It may be possible to do better than the overall stock market for a year or even several years, but eventually, have a bad year or years.
Some investors create their own index based on a portfolio or to gain specific insight.
Types of Indexes
Narrow Indexes:
Sectors: The S&P500 is made up of 11 sectors. Some investors prefer to look at strong and weak sectors to make decisions. The sectors include Information Technology, Health Care, Financials, Consumer Discretionary, Communication Services, Industrials, Consumer Staples, Energy, Utilities, Real Estate, and Materials.
The Tech Sector ($SPT) is very popular. Below is a chart.

Micro-sectors
SOX Index ($SOX), which measures semiconductors.
Below is a chart of the SOX Index

Geographic segments:
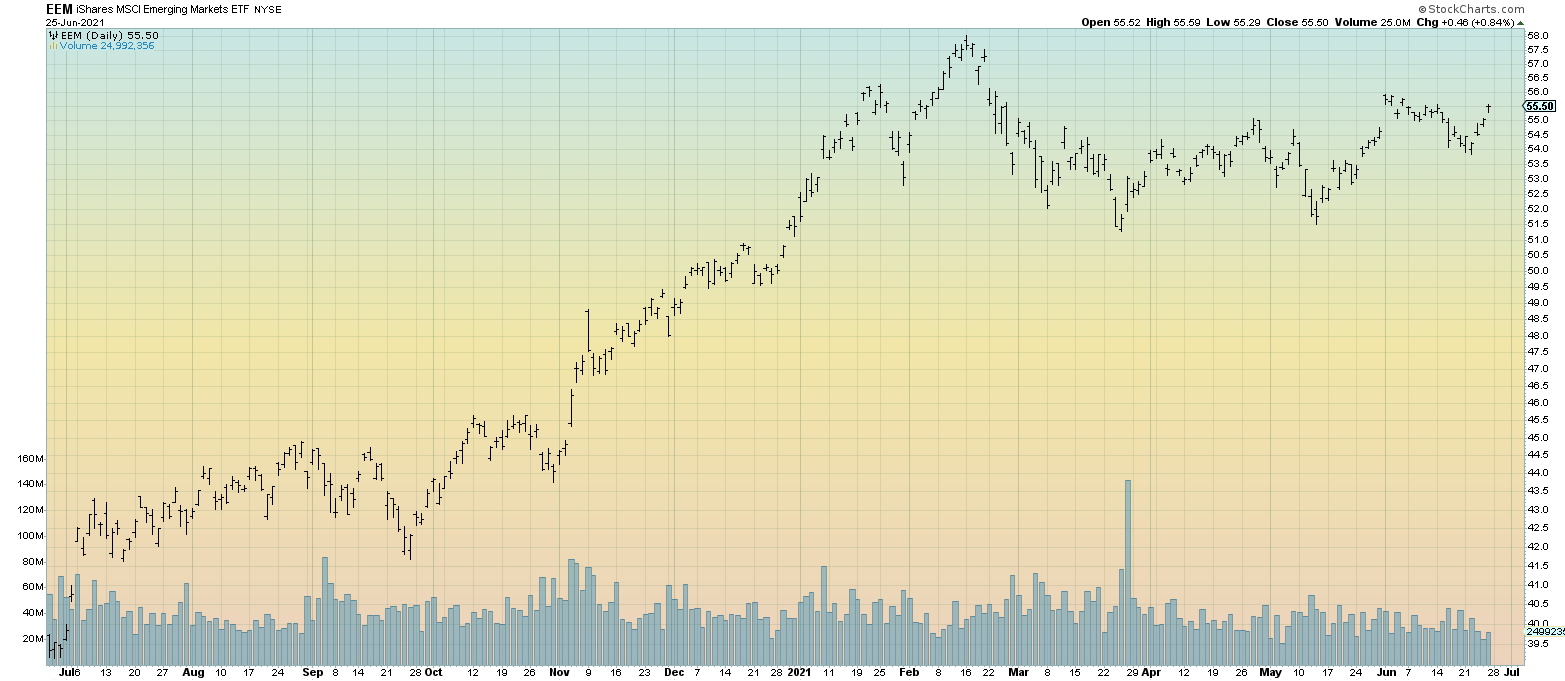
Emerging markets are very popular with some investors and traders. The EEM ETF covers many countries, including Taiwan, China, Japan, Brazil, India, etc.
Below is a chart of the Emerging Markets (EEM) ETF
World indexes
ACWI (All Country World Index) measures how stocks are doing on a world level.
Below is a chart of All Country World Index (ACWI)
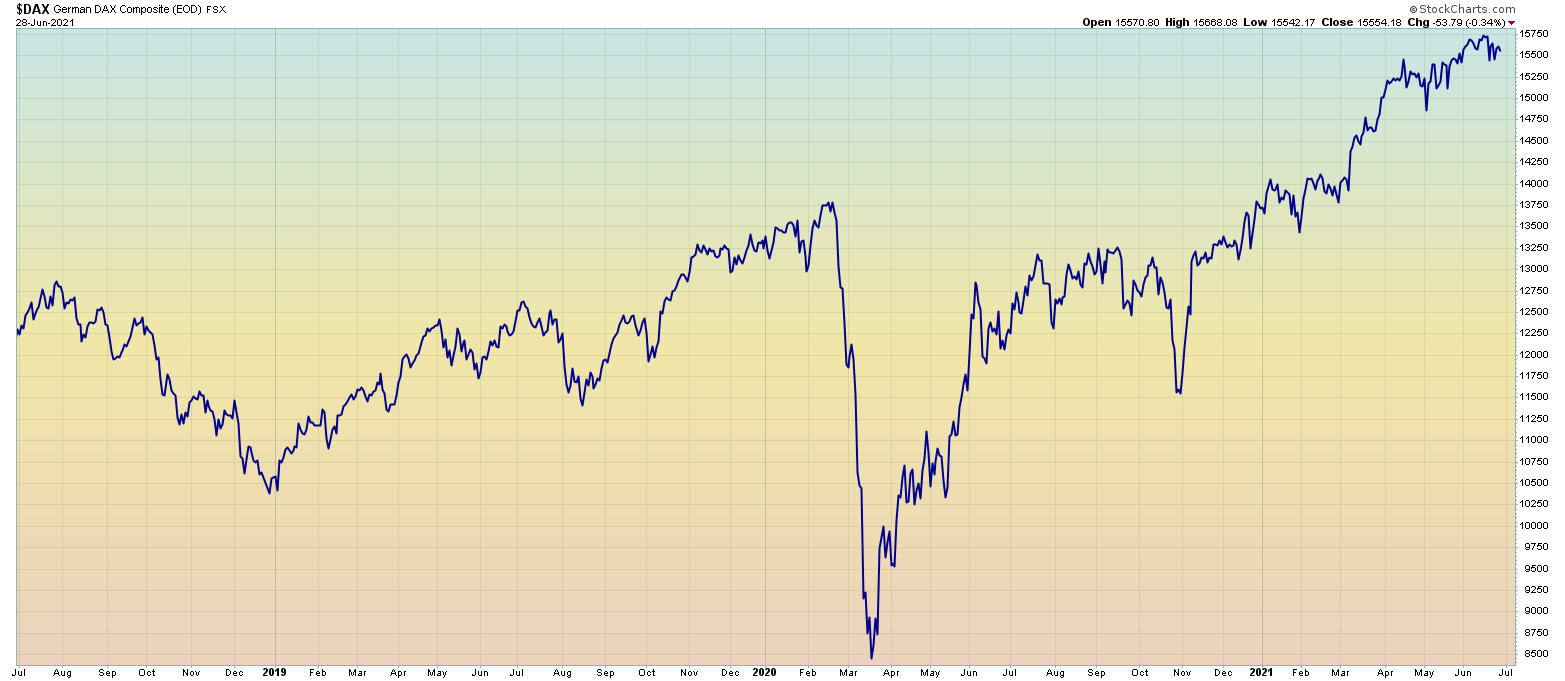
Germany ($DAX)
Below is a chart of the German DAX Index
 Japan Nikkei ($NIKK)
Below is a chart of the Japanese Nikkei Index
 Conclusion
There are thousands of indexes available. Some indexes help provide insight, while others duplicate what is already available. Still, others do not offer additional insight. Market participants find indexes that become popular. Indexes are used to create index funds and ETFs. The multitude of indexes used for insight is constantly changing. Comparisons can be made based on a big picture view or a more narrowly focused view.
