What is Market Capitalization?
Download (Login required) Audio PDF
Companies are different sizes and often categorized for convenience. Some prefer to focus on big companies that are more established, have stood the test of time, and trade lots of shares each day. Others prefer companies that are growing but have not reached the size of larger companies. Still, others prefer small companies that are likely new, on the verge of offering new technologies, or have innovative products or services that we might enjoy. Small companies are often not very established but may have significant future growth potential. Other companies are small and have around for ages.
For investing, market participants have a wide variety of company sizes from which to choose. While some may like having a large universe of stocks to pick from, others often find this overwhelming. One way to help make decisions is to know how a company is measured in terms of its capitalization or the street value.
When a company wants to raise money or gain notoriety, it will often decide to “go public.” This involves making part of a company available for others to own.
Companies have stock when they are created. The stock may be privately held by only a few people, or public shares available to buy and sell on a stock exchange.
Primary Market
When a company transitions from being a private company to a public company by selling ownership shares, this is called an Initial Public Offering (IPO). What typically happens is a company will hire an investment bank to help guide the process. The investment bank will help determine a company’s value, the number of shares to offer, and the price per share. A date is set for the shares to start trading on a public exchange, such as the NYSE or NASDAQ.
For example, a company has decided to sell off a portion of its shares. The value is $100 million. It is agreed that 10 million shares will be made available. After some quick division, it is realized that each share is worth $10. Once public, the initial market capitalization is $100 million.
During the Dot-Com boom and bust, it became very trendy to own shares before they even went public. Brokers would often offer shares to their high-end customers. Since the norm was for these stocks to skyrocket on the first day of public trading, those who already held shares could often sell them for a very high profit. For some, it did not matter if the company had good value or not. What was important was buying a stock at a low price and selling it for a high price. Many of these companies did not last long since the earnings needed to sustain them did not exist. Currently, a similar phenomenon is occurring with cryptocurrencies. People who know nothing about the financial markets look (and feel) like geniuses as they easily buy low and sell high. This may be great for a few, but it opens the door for a massive bubble to form, in which late-comers and those with little to no experience may be left with nothing. Some even say It might be the year 2000 version 2.0.
Secondary Market
After a company has an Initial Public Offering (IPO), shares are traded publicly in the stock market. Prices are determined by Supply and Demand. The stock market may conclude that $10 is a fair price and the shares stay around $10. Other companies may see prices soar above $10 per share or drop below $10 per share. The financial media seems to love pointing out shares that drop below their IPO price. As the stock price increases or decreases, market capitalization is determined.
Market Capitalization
Market Capitalization is the total dollar stock market value of a company. Sometimes this is referred to as the street value.
Market Cap = outstanding shares X Price for one share
Categories:
Each publicly traded company falls into one of the categories explained below. This can change over time. A company may have been small when it went public but, over time, grows. It may have become a middle-sized company and then a large company. Very few companies grow to become mega-sized companies.
Companies can fluctuate the other way as well. A large company may have fallen on hard times, is in the process of going out of business, or collapsing. It can work its way down to medium-size, small size, and perhaps to no size.
What follows are definitions for each category and the indexes used for tracking.
Categories Sizes
Mega Cap: $200 billion or more
Large Cap: $10 billion – $200 billion
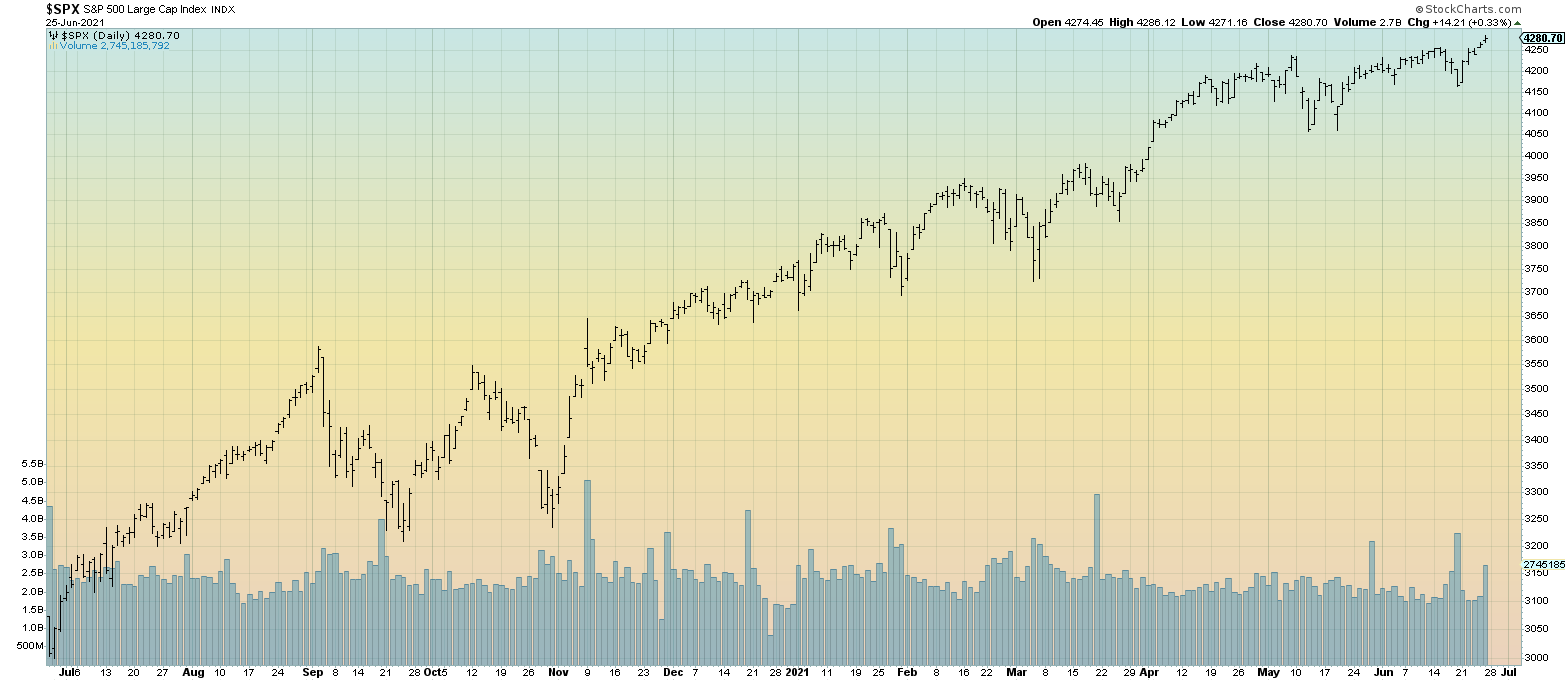
Indexes: Mega-Caps and Large-Caps are often a member of one or more of the famous and heavily followed indexes such as the Dow Jones Industrial Average, the S&P 500, and the NASDAQ 100. In many instances, stocks can belong to multiple indexes. For example, Microsoft (MSFT) is a member of all three of the major indexes.
The charts below are examples of each of the indexes.
DJX

SPX
NDX

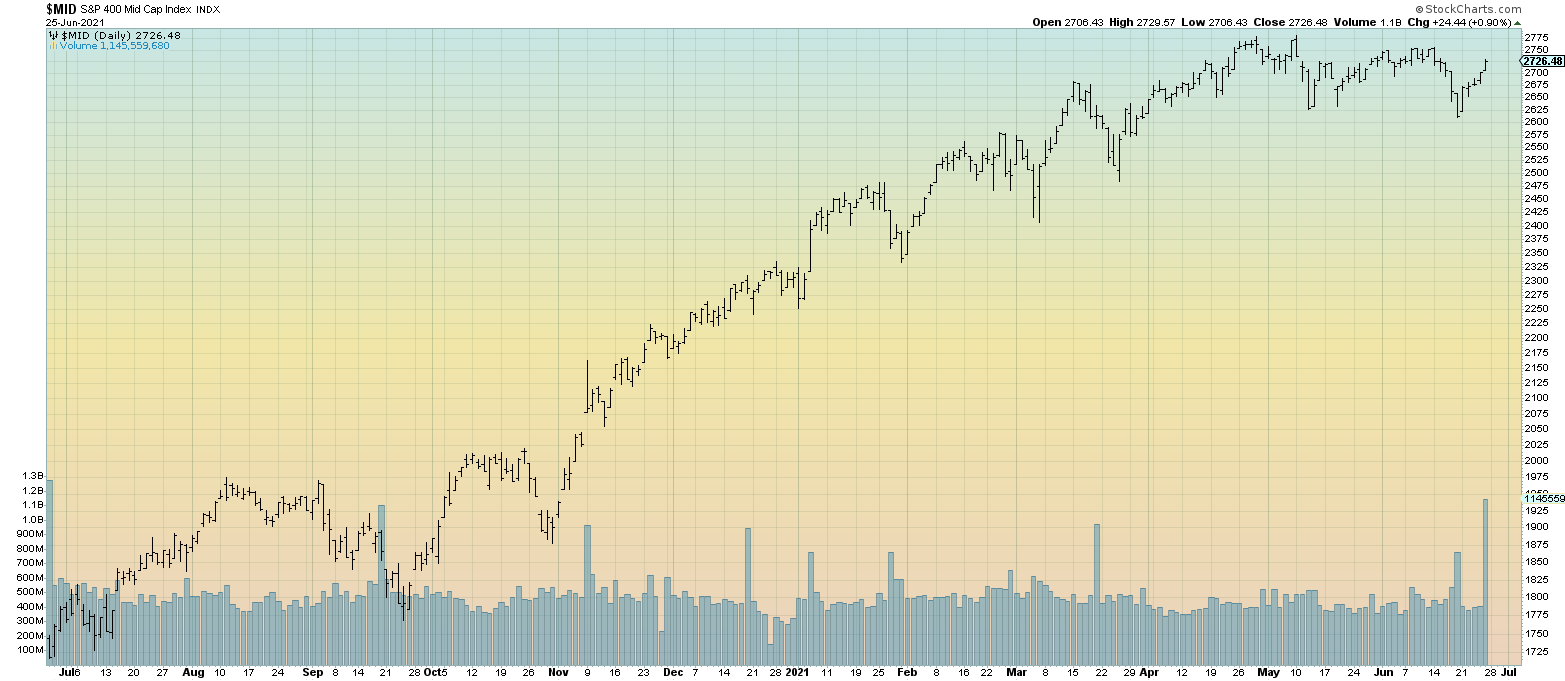
Mid Cap: $2 billion to $10 billion
Indexes: Mid-Caps have an index called the S&P 400.
MID
Small-Cap: $300 million to $2 billion
Indexes: For many years, the Russell 2000 was the most popular Small-Cap Index but has been primarily replaced by the S&P 600 Small Cap Index.
RUT/SML

Micro-Cap ($50 million to $300 million) and Nano Cap (Below $ 50 Million)
Russell 1000 Micro-Cap ETF

Why is Market Cap Important?
People prefer to base things on size. It is natural to compete to see who is first or who is the biggest. People find this interesting.
On the practical side, large companies are thought to be less risky than smaller companies. Some investors prefer companies they have heard of and know. Being familiar has its advantages, while other investors try to find companies that have not been heard of or receive little attention.
Size does not always matter. Kodak, Polaroid, and Blockbuster are just a few examples of revolutionary companies that were once household names that no longer exist.
Diversification
Some investors prefer to have size diversification. A bulk of a portfolio may be in large well-known companies that have been around for a long time. These companies tend to have a significant market share, a good reputation and are often more respected.
Additionally, investors may diversify into smaller companies since it is believed there is more growth potential.
Established companies can often offer more earnings stability and dividends. Small and mid-sized companies can often provide more significant growth potential.
Perceived Risk, Volatility, and Liquidity


Misconceptions
Real Value (Enterprise Value):
Market Cap is what investors determine to be the value of a company.
Fundamental Analysis (FA) tries to determine Real Value (Enterprise Value).
Buy-Out Candidates
If another company purchases a company, the price may differ from the market price (street price). Price is determined by the situation and condition of the company being bought. If a company is doing well, the offer price may be higher than the current street price. Conversely, if a company is desperate and in danger of going out of business, the offer price may be below the current street price.
Inflated prices often serve as an incentive for the company being purchased. For example, a company’s shares may be priced at $50 per share by the stock market, but a company seeking to buy may offer $60 per share.
Deflated prices often serve as a bail-out. For example, a company’s shares may have a street value of $10, but a purchasing company may offer $5 per share.
Top 20 as of the End of 2020
Since this is interesting to people, the list below shows the twenty largest companies on December 31, 2020. The top 5 are often called “The Four Comma Club.”
- Apple- $2.14 trillion
- Saudi Aramco – $2.05 trillion
- Microsoft – $1.61 trillion
- Amazon- $1.56 trillion
- Alphabet (Google) – $1.17 trillion
- Tencent – $797 billion
- Tesla – $783 billion
- Facebook – $716 billion
- Alibaba – $637 billion
- Taiwan Semiconductor (TSMC) – $556 billion
- Berkshire Hathaway – $548 billion
- Samsung – $503 billion
- Visa- $444 billion
- JP Morgan Chase – $423 billion
- Johnson & Johnson – $422 billion
- Walmart – $409 billion
- Kweichow Moutai – $388 billion
- Proctor and Gamble- $334 billion
- United Health – $333 billion
- Nestle – $327 billion
