A Simple Yet Powerful Investment Strategy
Download (Login required) Audio PDF
The Simple Moving Average Crossover system (SMAC) is a popular strategy. It can be attractive for those who have limited time. Some investors may like the opportunities offered in the stock market but don’t like the idea of spending too much time or effort with their investments.
SMAC is straightforward, relatively easy to implement, and requires little babysitting beyond periodic checks. The strategy makes all decisions. The only requirement is to act on the generated signals, which involves placing a buy or sell order with your broker or mutual fund company.
SMAC is far from perfect (no system is). However, its most significant advantage is that it can keep investors on the right side of the trend and help avoid significant opposing trends. Additionally, for those who initiate both long and short positions, SMAC can be used to profit from uptrends as well as downtrends.
I originated the name SMAC. The strategy is also commonly known as the Golden Cross for uptrends and the Death Cross for downtrends.
The desire is to outperform a buy-and-hold strategy. There are times when SMAC will underperform buy-and-hold strategies. Nevertheless, some still appreciate this strategy due to the peace of mind it can bring. Some are willing to sacrifice times of higher returns in exchange for recking havoc on emotions. The idea is to let the strategy tell you what to do rather than interpret current price action or predict future price movements.
For those new to using charts, a few definitions may help.
Definitions
Charts
A stock chart provides a visual representation of historical prices, which can provide context. The most common charts are daily charts. However, weekly, monthly, quarterly, and yearly charts can be used.
Intraday Charts
Additionally, some charts provide intraday data. Charts that update in real-time can be helpful for insight. Any timeframe can be used, such as a 1-minute, 5-minute, 10-minute, 30-minute, 60-minute chart, and so forth. Often, more than one timeframe is watched at the same time for multiple perspectives. Intraday charts are necessary for day-traders but can also be used to understand the current ebb and flow of price movement.
NOTE. I do not participate in or teach about day-trading. However, I follow a 10-minute chart of the S&P500 (SPX) at all times. I may also bring up a 30-minute or 60-minute chart. If an impending announcement or unexpected event may produce wild price movement, such as an FOMC announcement, I may bring up a 1-minute chart just for fun. Intraday charts help to “get a feel” for what is happening. This can help make decision-making easier. Additionally, greater confidence is experienced since the price movement context is already known.
Intraday 10-Minute Candlestick Chart

Daily Charts
Some charts may only go back a few days, while others may go back months, weeks, years, or decades. Having multiple views is good practice.
There are different kinds of charts which can include:
- Line charts usually display only closing prices, although other data points can be plotted. This is the only alternative for mutual funds since mutual funds only have one price each day, called the Net Asset Value (NAV), which is calculated shortly after the close. Some prefer line charts to keep what they see as clean and as easy to read as possible. Below is a line chart of the S&P500 (SPX) going back to 1980.
SPX Line Chart 1980-Present

SPX Line Chart 1 Year

- Bar Charts are very popular since more information is included. The Open, High, Low, and Close are plotted.

SPX Bar Chart 1980-Present

SPX Bar Chart 1 Year

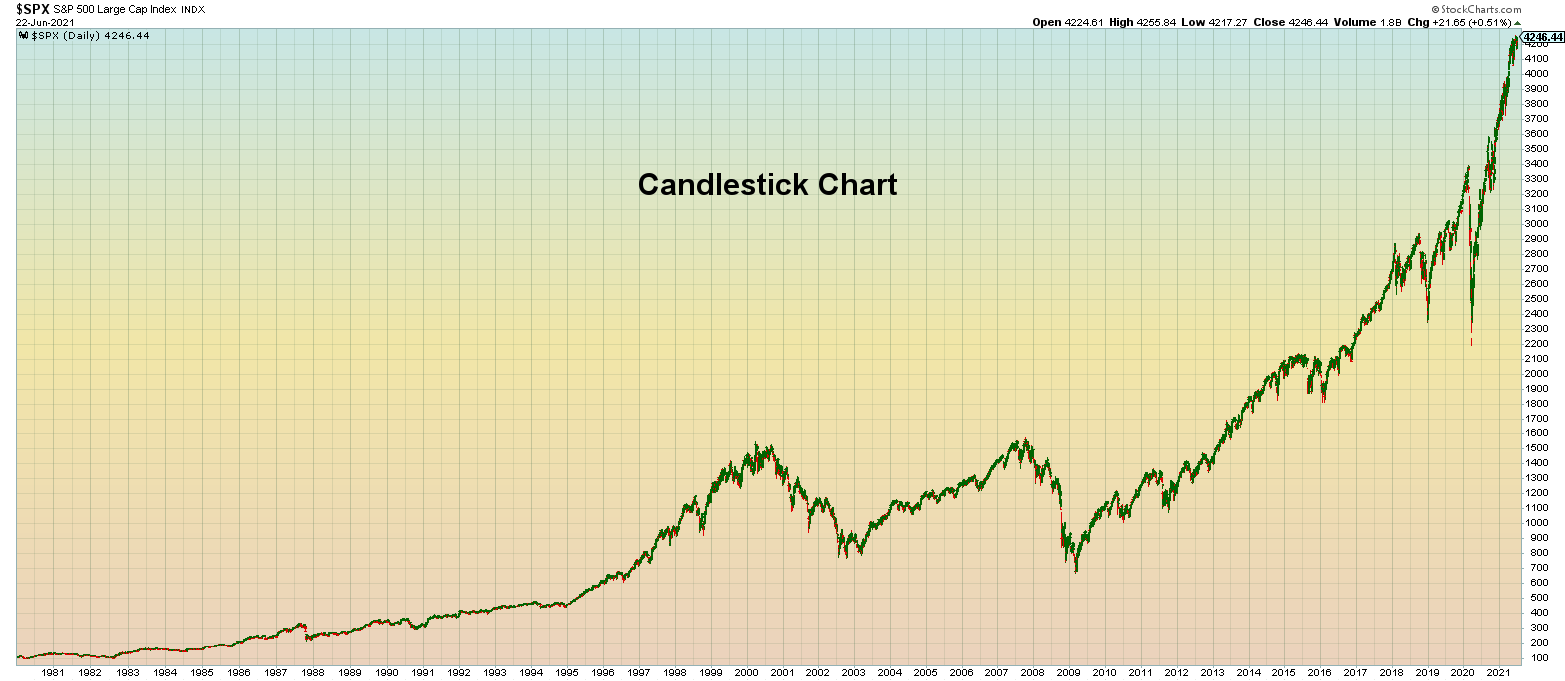
- Candlestick charts have also become very popular. Similar to bar charts, candlestick charts show the same information in a manner that provides more insight. Candlesticks are a variation of bars and offer more visual context of price action. For many, this is the chart of choice. Myself included.
Candlestick Bars

SPX Candlestick Chart 1980-Present
SPX Candlestick Chart 1 Year

Moving Averages
Moving averages are the most common and most popular indicators used in Technical Analysis (TA). A moving average is calculated when prices are added together and then divided by the number of periods to get an average price. The next period will see the current period added to the calculation and the first period dropped off. Over a period of time, a line is drawn that shows a smoother average of prices, yielding valuable information. The direction of the line, the relation of the line to the current price, as well as one moving average in relation to another moving average can provide helpful insight.
Moving averages can be calculated in slightly different manners. A Simple Moving Average (SMA) gives all periods the same weight or level of importance. However, some feel the first periods used should not be as crucial as more recent periods. In which case, each number is weighted to reflect prices closer to the current price. Weighted Moving Averages and Exponential Moving Averages are popular with many market participants. For the sake of this strategy, Simple Moving Averages (SMA) will be used, although other moving averages can be used.
50 Period Simple Moving Average (SMA)
50 periods are added together, and the result is divided by 50.
200 Period Simple Moving Average (SMA)
200 periods are added together, and the result is divided by 200.
The 50 and 200-period simple moving averages were selected because of popularity. There is no magic when it comes to choosing calculation periods. A particular calculation method may work great in one environment but fail badly in another. Millions of market participants use 50 and 200-period simple moving averages to make decisions. When one moving average is crossing another moving average, it is such a big deal that even the financial media have even been known to take notice.
Idealized Approach
A successful strategy is dependent upon numerous variables. Ideally, there should be no emotions involved since fear and greed can wreak havoc on even the best strategies. Instead, a purely mechanical system is desired in which the charts dictate what needs to be done or not done.
Additionally, both long and short positions will be demonstrated in this discussion. However, many investors decide not to go short. An alternative to “playing the downside” is to remain on the sidelines until a buy signal is generated. Other participants like the idea of going short and understand that downtrends are just as much a part of the markets as uptrends. Regardless, only long positions or a combination of both can be implemented.
Long and Short
Long and Short are terms used widely in the financial markets. When an investor is long, that means the desire is for prices to go up. When an investor is short, that means the desire is for prices to go down.
To read a more in-depth discussion on long and short, please click here.
SMAC Advantages
Compared to other strategies, SMAC is considered simple. Please understand that if you are new to the markets, nothing is simple. Being simple or complex is a relative term and will apply differently to each person. However, in the context of comparing SMAC to other strategies, SMAC is simple.
SMAC can be implemented by using an index equity fund or ETF. SMAC can be used on individual stocks and a variety of mutual and ETFs. For this example, an S&P500 Index Fund and ETF are used.
The tools needed to implement SMAC can be found online for free. Numerous websites have charting capabilities. Additionally, most online brokerage accounts offer charts. Since the 50 and 200 SMAs are so popular, pretty much any charting tools will enable these moving averages to be plotted.
SMAC will keep you on the right side of the trend most of the time. There are certainly exceptions, but they are typically short-term. It can be very dangerous to go against the primary trend even when prices looked to have bottomed or topped. Going against what the chart is suggesting is not recommended. If SMAC is followed, your investments will be in the same direction as the trend, at least most of the time.
SMAC is adaptable in that positions can be long, short, or both.
SMAC is flexible and can be applied to individual personalities, styles, and methods. Market movements can be captured more simply than by going long or short with individual stocks. An investor can get out of the market and get into a money market fund during bear markets (down) and get in during bull markets (up), or switch sides to try and take advantage of both types of market action. SMAC can be used with mutual funds and/or ETFs, which are very popular and readily available.
SMAC allows for aggressive and conservative methods to be implemented. SMAC can be used “as is” or “tweaked” for attempts at greater returns. SMAC was designed to be used with a stock index fund or ETF such as an S&P 500 index fund or the SPY ETF. More aggressive methods can be used, such as applying additional indicators and implementing enhanced, leveraged, or inverse vehicles. Additionally, hedging and income opportunities are possible to implement. SMAC can become as crazy or as simple as you want it to be.
SMAC follows the long-term primary trend. Trends can last months or even years. Although it is best to check things daily or at least periodically, actual decisions or changes requiring entering or exiting the market may go many years between occurrences.
SMAC Disadvantages
The SMAC Strategy is not perfect. There will be losses. Whipsaws and fake-outs can and do happen. Since moving averages are lagging indicators, market action can occur faster than an MA’s ability to react. By the time an MA calculates a move, it may be over. This is one frustration of the SMAC Strategy.
Also, during times of choppy market conditions, there will be losses. Moving averages measure for a trend, whether there is an actual trend or not. There are significant periods when the markets move sideways. A moving average will continue to calculate and give signals anyway. Rather than decide if a signal is legitimate or a fake-out, the SMAC Strategy suggests that all signals be followed. If other choices are made, this allows room for emotions to enter and defeats the purpose of using a mechanical system.
The SMAC Strategy can be emotional for investors at times and go against logic. Those who pay attention to the markets and news may be reluctant to follow a signal that has been generated. Logic may suggest waiting or doing the opposite. SMAC signals should be followed regardless of what reasoning and feelings may suggest.
SMAC can take time to generate a signal. Longer-term moving averages calculate slower than price changes. When prices have appeared to bottom, this can often happen quickly in which a V-Shaped bounce occurs. A moving average will often miss such a fast event and delay giving a signal. This causes a lag time when entering or exiting the market, which can be great when waiting works to an investors’ advantage but can really suck when it leads to a whipsaw, false breakout, or choppy environment.
If SMAC is to include short positions, it may require moving to a mutual fund company with inverse index funds. This can depend on individual situations. It is best to check and see what mutual funds are available.
Another drawback is that long-term positions can lead to complacency and forgetfulness. As stated earlier, trends, especially uptrends, can last for years. It may be easy to forget about an investment until it is too late. Signals may be missed. It is possible to set up messaging and alert systems to inform an investor that a signal has been generated. However, if such methods are not implemented, obviously, no signal will be received.
Warning. Several years ago, I tested SMAC using weekly charts. The results were pretty bad, so I stopped testing. The lag-time was just too great. It is recommended to base SMAC on daily charts and not weekly charts.
Mutual Funds Vs. ETFs
Mutual funds have provided an excellent low-cost method for individuals to invest. However, over the last 20 years, there has been an explosive growth in the popularity of ETFs. For many, ETFs are preferred over mutual funds. Either can be used to implement the SMAC Strategy.
Examples
In these examples, two investment vehicles will be used:
- Vanguard 500 Index Fund Admiral Shares (VFIAX) is a mutual fund based on the S&P 500. Incidentally, this was the very first index fund created. It was the brainchild of John Bogle. This implementation will only consist of long positions, hoping prices will go up.
- The SPY is an ETF based on the S&P 500. The SPY ETF was created in 1993 and was the very first ETF. Both long (up) and short (down) positions will be demonstrated.
One More Criteria
Simple Moving Averages (SMAs) will be used rather than Exponential Moving Averages (EMAs). Either or both can be used. The differences, strengths, and weaknesses of SMAs and EMAs are covered more in-depth by clicking here.
Strategy: The SMAC System
The 50/200 Simple Moving Average Crossover System.
Execution Rules:
A long position is initiated when the 50 SMA crosses above the 200 SMA. (Short positions, if any, are closed)
A short position is initiated when the 50 SMA crosses below the 200 SMA. (Long positions, if any, are closed)
Usually, this is a long-term strategy with positions lasting weeks, months, or years. There may be times when positions last only a few days. These can occur during times of indecisiveness or after a fast and severe decline, followed by a quick bounce.
Optional parameters for initiation:
- It is usually best to initiate a new position as close to the market close as possible since the closing price most accurately reflects the actual price for that day. This may not be possible for some due to busy schedules and an inability to access a brokerage account. As a result, entry may be delayed until the next day.
- A new position is initiated if the market closes in the direction of the strategy. If going long, a new position is only entered if the market is up. If prices fall, this may have changed the climate.
Chart showing entries and exits

Back-Tested SMAC Results
The following results were calculated using ThinkorSwim software with a written script adapted to the SMAC Strategy. Long and Short positions were entered using the SPY ETF. Care should be taken with the results since they have not been verified by an external source (any volunteers?). However, this should provide a good idea concerning how the SMAC Strategy has performed since 1994. Also, please note the drawdowns in the equity curve as the signals were not yet generated. As of June 22, 2021, the equity curve value has risen to $27,546.


Money Market Accounts
If only long positions are executed, there will be times when an investor is out of the market. Funds not being used in the market are placed in a Money Market Account.
Money Market Accounts are available at mutual fund companies and brokerages. Typically, this is where funds go when a deposit is made. They are very safe, very liquid, and interest-bearing, which is generally compounded daily. Money Market Accounts are used as a place to “park cash.” Sometimes “Cash is King” when waiting to make a decision or if the market is falling apart.
Vehicle Alternatives
Many different investment vehicles can be used to implement The SMAC Strategy. This can include using the SPY ETF or other S&P 500 ETFs, regular or enhanced SPX Index Funds, inverse SPX Index Mutual Funds, and Inverse ETFs. There is a wide variety available that allows for tailoring the SMAC Strategy to each individual.
Conclusion
The 50/200 Simple Moving Average Crossover (SMAC) Strategy is a relatively simple to implement mechanically-based investment system that can take advantage of long-term trends. SMAC flexibility allows for minimum effort, access to free tools, avoidance of losses, and profit capture during significant market declines. SMAC can enter long, short, and/or long and short positions. SMAC can be implemented conservatively or aggressively. However, it may be necessary to make adjustments to current accounts to allow SMAC to be implemented. No system will be correct 100% of the time, so investors must understand that there will be minimal losses. Overall, The SMAC Strategy can be used as a dynamic and powerful investment strategy.
