Stock Prices and Interest Rates
Download (Login required) Audio PDF
Stock Prices and Interest Rates
Do interest rates have a significant influence on stock prices? If so, how? New market participants are often told that rising interest rates are bad and falling interest rates are good. Is that true? Can we have a good idea if and when rates will be adjusted?
As a prelude to this discussion, there is one area to address: Relatively new investors have not endured a 1970s-1980s environment of high interest rates coupled with high inflation. Additionally, now there are generations of money managers, both seasoned and new, who have not experienced this either. What kind of reaction may occur if the US enters these types of economic conditions? Nobody is sure, but it is worth becoming educated and being prepared.
The Current Situation
As of May 2021, interest rates remain at historic lows. If the US economy continues with the current post-pandemic recovery, interest rates will likely be raised in the future. As Congress and the Fed attempt to stimulate and change the economy, any growth is being closely watched for signs of inflation.
Some market commentators say interest rates will double, triple, or quadruple in response to the massive increase in the money supply and continued government intervention. Others paint a rosier picture by claiming that the future is going to be bright and shiny. Who is right? Both, and neither. So, why bother? Simply, to be ahead of the game. The markets need to be watched closely, and a plan must be made now, not after events happen. The idea is to be proactive instead of reactive. As witnessed in February-March 2020, adverse events can be sudden and severe without little warning. It is rare for the financial markets to be caught off-guard, although it can happen. The financial markets are excellent leading indicators of what the future holds. Excellent does not mean perfect. However, for longer-term changes, the markets give off clues if it is known where to look.
Who Sets Interest Rates?
The Fed Funds Rate is set by the Federal Open Market Committee (FOMC). The FOMC has regularly scheduled meetings, typically about every six weeks. The financial markets look to these meetings with great anticipation, trepidation, and speculation. Being on “Fed Watch” has become standard when an announcement or interest rate adjustment is expected. It should also be pointed out that the FOMC can convene at times outside of any scheduled meetings. During times of calamity or extreme economic emergencies (such as 9-11), the FOMC can gather and act.
At FOMC meetings, the current economic outlook is discussed. Committee members vote to raise, lower, or keep interest rates at current levels. The FOMC does not change interest rates directly. A target range is set for overnight lending rates between banks. As this target rate fluctuates, a domino effect flows through the US economy, as other interest rates are adjusted in response. Currently, the target rate is 0-0.25%. As long as banks are within that range, the FOMC request is being fulfilled.
Do Interest Rates Matter?
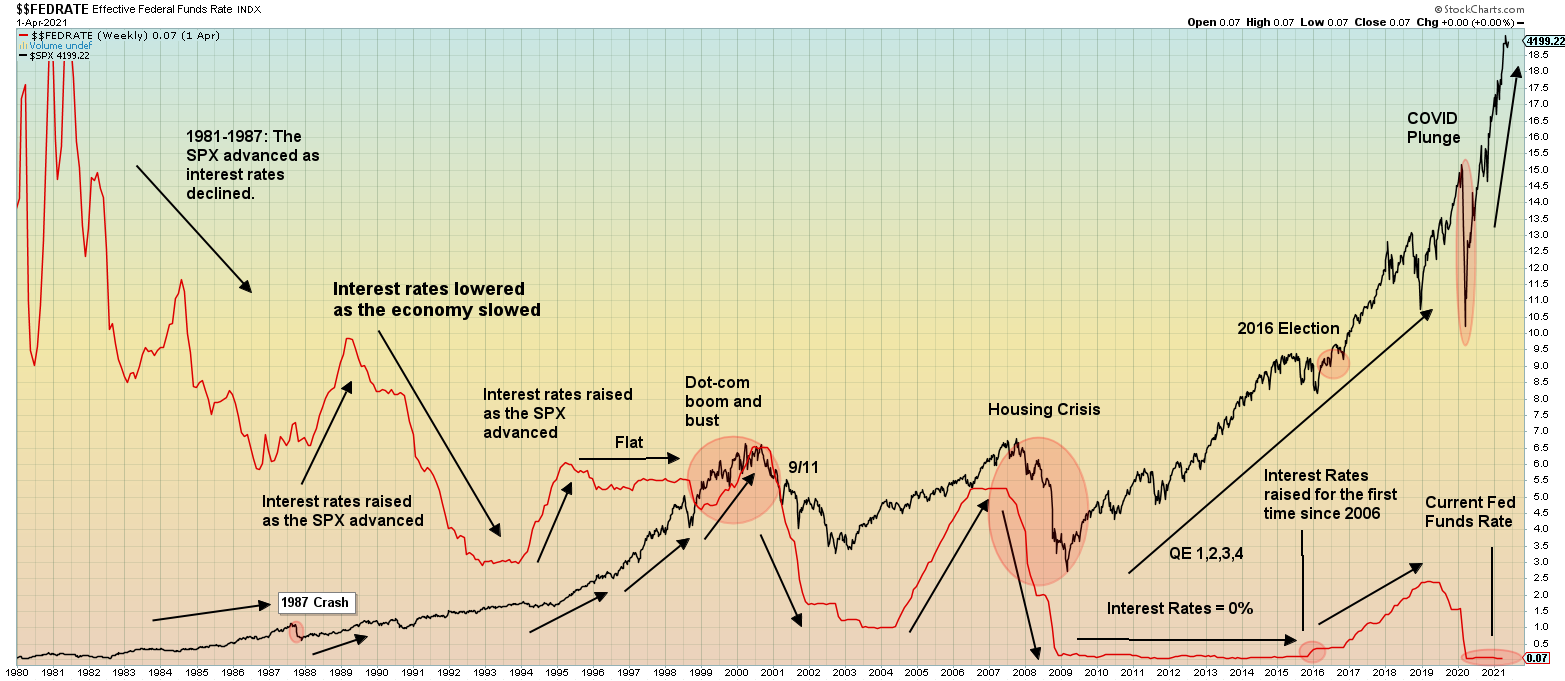
Do stock prices go down when interest rates go up? A historical chart of the S&P 500 (SPX) Index combined with the Fed Funds Rate can quickly answer this question.
An Overview of Interest Rates since 1980
It is helpful to look back to see how interest rates and stock prices have behaved historically. For this discussion, we will go back 40 years.
The late 1970s and early 1980s experienced a high inflationary environment coupled with high interest rates. During times of high inflation, interest rates are raised. This makes money and borrowing more expensive, increasing the US Dollar value while decreasing money flowing in the economy. The late 70s and early 80s saw stagflation, in which inflation was high, yet real economic growth was minimal to non-existent. This was peculiar, yet not unprecedented. It could happen again.
During other periods of “normalcy,” if the economy steams along too fast, interest rates are raised to slow things down to control inflation. If the economy is declining, with lost jobs and loans more challenging to get, interest rates are lowered. Borrowing money becomes less expensive and more accessible. The goal is to stimulate the economy by putting more money into the system.
In 1980, Ronald Reagan was elected president and implemented the idea of trickle-down economics, dubbed Reaganomics. Government spending was cut at the social level and increased at the military level. Taxes and regulations were cut while the money supply was decreased. The idea was for these changes to flow down and benefit the entire economy. The Laffer Curve and supply-side economics were also implemented by cutting taxes to increase economic spending, which would theoretically increase tax revenues. Some agreed, while others felt it was terrible economics. However, it helped at that time. Interest rates and inflation declined throughout the 80s. The stock market advanced for much of the 80s until the crash of 1987. After the 1987 crash, interest rates were adjusted, and the SPX Index started to recover. As the stock market advanced, interest rates were raised.
The economy started to decline in the late 80s and early 90s. The Fed lowered interest rates. Bill Clinton was elected president in 1992. It’s debatable, but some believe that many of the policies enacted during the Reagan/Bush years set up the boom experienced in the mid-to-late 1990s. Others think Bill Clinton was the answer.
During the 1990s, the stock market started to advance while also seeing the birth of the Internet. In the late 90s, until 2000, interest rates remained flat as the stock market soared. The rise was primarily fueled by the dot-com boom and resultant bust. As the market popped and was heading down, 9-11 happened, which destroyed the US economy for a few years. Interest rates were raised mainly during the boom, leveled off during the bubble, and then declined as things got ugly.
In 2002, interest rates leveled off again, but there wasn’t a robust economic recovery. In 2003, the SPX finally bottomed and started to climb, as did interest rates, into 2007. Then came the 2008 financial crisis. Stocks fell off a cliff. Interest rates were lowered to stimulate the economy and eventually hit zero.
Up until 2008, it is clear that stocks and interest rates tend to move in tandem. Both go up and down together. This dispels the hypothesis that interest rates cause stocks to do the opposite. Logically, economic growth also sees stocks advance. Interest rates are raised to control inflation. During economic weakness, interest rates are lowered to help stimulate economic growth.
However, since 2008, something peculiar started to happen. With interest rates at zero, the market eventually started to go back up. As the SPX climbed, interest rates were not raised. Why? The biggest reason was Quantitative Easing (QE). QE is something that the Fed said they would never do but did it anyway. QE was done in the name of saving the US and world economies from complete collapse. QE starts by creating new money. Next, the new money enters the economy by purchasing US government bonds. Massive buying pushes bonds price higher. As bond prices go up, interest rates go down. 2008-2014 saw QE implemented four times. Low interest rates enticed investors to seek higher returns in the stock market. The SPX advanced but was not coupled with a corresponding rise in interest rates. Interest rates stayed at zero until 2015.
Implementing QE is hotly debated. Some see it as necessary, while others see this level of government intervention as dangerous. Regardless, it was what happened.
The day interest rates were raised for the first time in late 2015 was like Armageddon. Briefly, things went out of control in the markets, even though it was not a surprise. Some people wanted to react anyway. For the next couple of days, prices gyrated. The SPX was in an overall uptrend at that point, and prices recovered.
The charts below are 10-minute intraday charts of the S&P 500 Index before, during, and after interest rates were raised in 2015.


The 2016 Election
In 2016, Donald Trump was elected president. Upon entering office, he took away a lot of government regulations. Since he was a businessman and not a politician, he saw things differently. He changed a lot of the ways that things were done. A lot of people loved him, while others despised him. The media hated him with a passion, which helped create real tension that is still going on to this day.
When Donald Trump came into office, there were improvements in the economy, while others don’t see his methods as having a positive impact. The Fed started to raise interest rates as the economy grew and the stock market climbed. However, in early 2020, everything changed as the COVID-19 pandemic struck the world. This is the present situation.
History aside, the Fed is an independent agency that is free to make decisions. Most presidents have never commented on Fed action. Well, this is when Donald Trump would get on his Twitter account and start tweeting (paraphrased): “What are you guys doing raising interest rates? You should be lowering them. We want to keep stimulating the economy” That’s what a business person would say. A businessman is concerned with growth despite inflation and debt.
In 2021, a new administration is changing things, whether US Citizens realize it or not. The country is relatively uneducated about where things are headed. Modern Monetary Theory (MMT) is being implemented, while most have no clue what that means. An attitude of “At least it’s not Trump” prevails in the media and in many social circles. Regardless of personal opinions, MMT is here. It is uncertain what the effects will be. Each side has its reasons, justifications, and predicted outcomes.
Foreseeing Interest Rates Changes
Leading Indicators
There are many leading indicators that investors should follow to help anticipate future economic conditions. In addition to the stock market, these include the yield curve, durable goods orders, manufacturing orders, and building permits. What follows are additional areas that can be investigated and analyzed. There is no perfect indicator. However, taken together, the following indicators can provide helpful insight.
Copper
Cooper has been a reliable leading economic indicator for a long time. It has even earned the nickname “Doctor Copper” since it is good at measuring economic health. At the early stages of economic reversals, copper will often reverse first. Some suggest copper is outdated as a leading indicator, having been replaced by silicon. Others suggest copper will be in great demand in the future as new technologies are unveiled and adopted.
Copper Chart

As the world was locked down, copper rebounded and doubled in price. This suggests that brighter days are ahead since copper is used heavily in manufacturing.
The CRB Index
The Commodity Research Bureau Index (CRB) is an index of 19 commodities organized into Energy, Agriculture, Precious Metals, and Base/Industrial Metals. Commodities form the basis of goods that are purchased. If the CRB Index is going up, prices will likely follow, leading to higher interest rates as inflation becomes a concern. The CRB Index is periodically revised, which produces debates concerning its effectiveness as a leading indicator.
The CRB Index Chart

As with copper, the lockdowns of 2020-2021 saw the CRB Index reverse into an uptrend. This may also suggest an economic improvement, which may lead to inflation and interest rate adjustments.
The Baltic Dry Index (BDI)
The Baltic Dry Index (BDI) is a London-based index that measures shipping costs for transporting dry bulk materials by sea. The BDI is often viewed as a leading indicator to measure the supply and demand of manufacturing materials. As costs increase and decrease, prices may follow suit, impacting economic growth and interest rates.
The BDI Chart
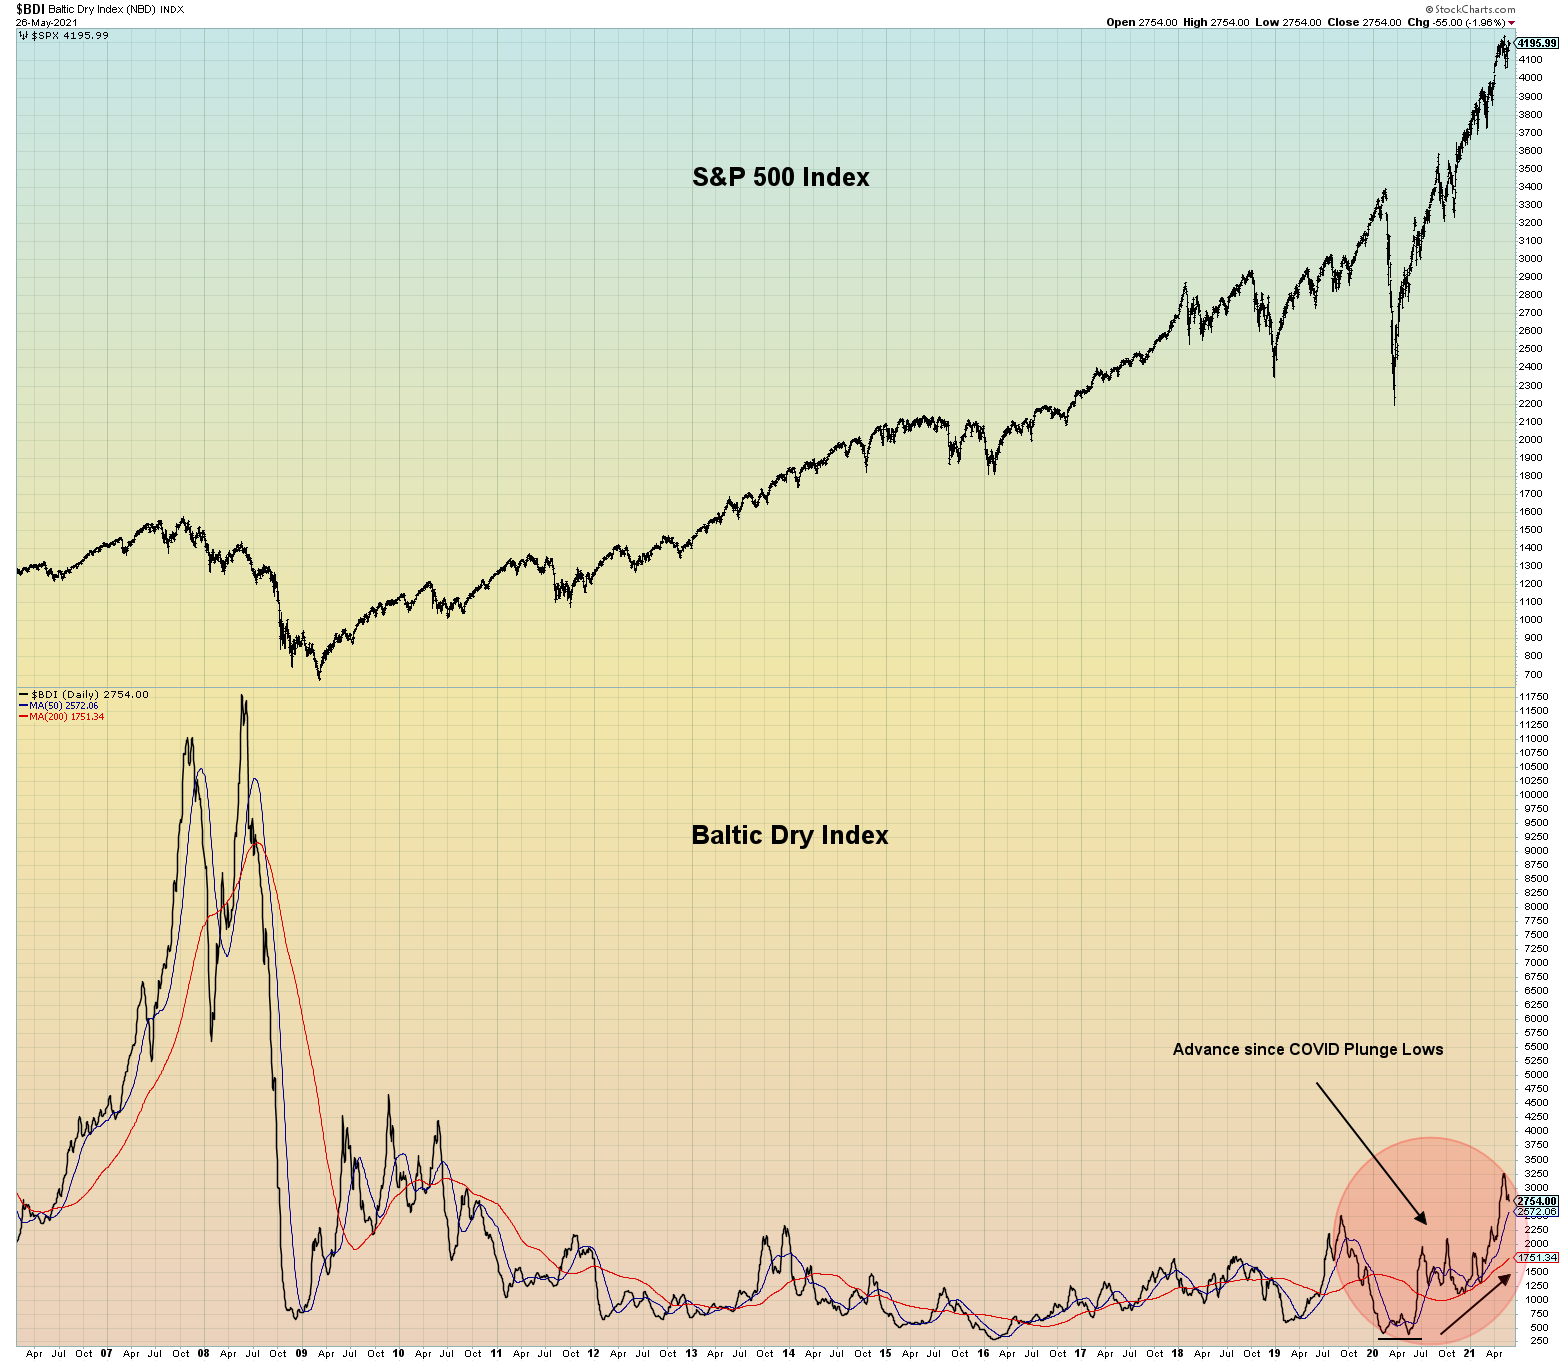
The BDI can be volatile and is analyzed better by plotting moving averages to measure trends. Currently, the BDI is in an uptrend, reinforced by the Suez Canal blockage incident in March 2021. Although the BDI is increasing, it is not showing as much strength as the CRB Index and copper.
Gold
The big daddy for measuring inflation is gold. Inflation doom-and-gloomers love to declare the necessity of buying gold. Gold can be an excellent vehicle, and investors should diversify in all of the precious metals, including gold. Those that declare the eventual death of the US Dollar preach the benefits of buying gold. Still, others tout the wisdom of buying cryptocurrencies.
History has shown that gold makes people crazy. It is easy to get caught up in the hype when gold is in favor. However, advertisements with celebrities and famous people often lead the masses to buy gold at the wrong times. Owning gold is very wise and is an essential part of a well-balanced portfolio. When and how gold is purchased is what needs to be learned. When everybody is talking about it, that is rarely the time to buy.
GLD
There is a popular Gold ETF (GLD) that is backed by physical gold. It is designed to correlate with the price of Gold. It began trading in 2005. The GLD ETF trades like a stock and enjoys excellent liquidity. An interesting event happened at about the same time GLD became available back in 2005. Gold was around $400. About the same time, M3, which was the broadest measure of the US Money Supply, stopped being reported. The fear of a lack of information helped influence gold prices to climb. Surrogate M3 measurements, including MZM, have been developed and are now used. However, it is interesting that those two events happened around the same time. Was it a coincidence? A solid answer has been hard to find as time passes on.
GLD Chart

If there is a fear, whether real or perceived, that inflation and interest rates will go up, there should be a corresponding rise in gold. However, gold has been trending down. Typically, as gold prices increase, the US Dollar decreases in value. However, both have been in a declining trend.

The Inflation Rate
Each month, the current and official inflation rate is published. As with most government reports, some see value in the report, while others discredit the information. Other helpful variations can be used for insight. However, the published Inflation Rate is what the markets use, so it should be consulted.
The Inflation Rate Chart
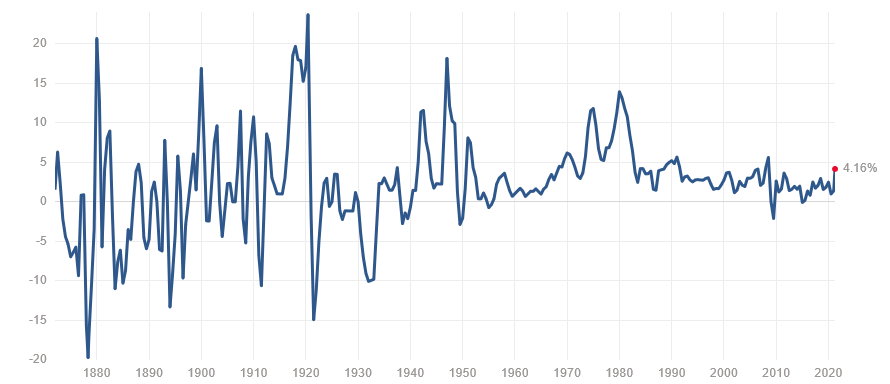
The chart below dates back to the 1880s. Inflation was at 1.68 percent, based on the Consumer Price Index (CPI). However, in April 2021, there was a surprising jump in the inflation rate to 4.16%, giving the media and pundits plenty to fret over. The current target by the FED is for inflation to be at 2%. If inflation remains above 2%, it can be expected that interest rates may be raised sooner rather than later.
Source: https://www.multpl.com/inflation
The US Dollar Index
In 2020-2021, the US Dollar dropped about 10%. The decline was from about the 100 level to about 90. The Euro has been climbing. As the US Dollar loses value, more US Dollars are needed to achieve the same level of value. This is inflation.
Currencies, for the most part, tend to trend well. That doesn’t mean they go straight up or straight down. There are bumps along the way, but currencies tend to stay in a particular direction until something significant makes them change direction.

In 2017, the US Dollar Index was over 100. It came down and reached the 88-90 level, formed a base, and then shot up to back above 100. Currently, the USD Dollar Index is back down below 90. The genuine concern will be if it drops to the 80 level again.
The Fed Watch Tool
The Chicago Mercantile Exchange website has a helpful free tool called The CME Fed Watch Tool. It shows what the market thinks will happen with interest rates at the next FOMC meeting and into the future. This tool is recalculated every day. It is freely available and does not require an account. Other information includes a countdown to the next FOMC meeting, which has become a significant market event.


When an interest rate decision or market-moving statement is expected, the markets will usually be tranquil with a slight upward trend ahead of an announcement. This can be expected at about 11-11:15 AM PT or 2-2:15 PM ET. Also, three weeks later, the FOMC minutes are released. That has become a big event at times too. The markets can read what FOMC Members discussed and how they voted. The markets try to read secret meanings into these meeting minutes for insight. If there are surprises, the markets can gyrate, at least for a while. What often happens is after a period of gyration, the more significant and prevailing trend is resumed.
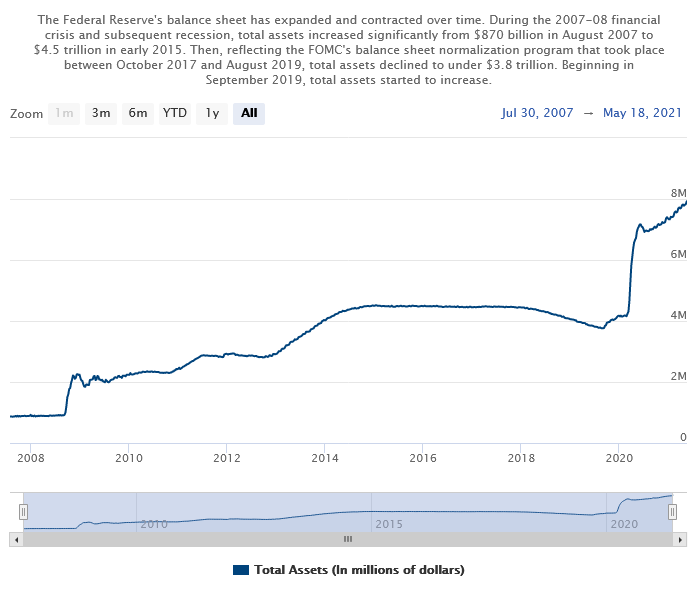
The Fed Watch Tool determines the probability or likelihood of any FOMC action. Currently, the markets predict a 93% probability that the Fed will keep the target rate at 0-0.25%. Based on statements made by Fed Chair Jerome Powell, the current stance is that rates will remain at the current target rate. He also stated that QE tapering (selling the bonds that the Fed has been purchasing) would likely occur before rates are raised. This can be monitored by looking at the Fed’s Balance Sheet.
As of May 2021, the US economy is in an optimistic mess but has proved more resilient than many had anticipated. As new economic reports are released, the markets will adjust any interest rate views, if necessary. The FOMC and the Fed should do what the markets are declaring, but it doesn’t always work out that way. The Fed Watch Tool has been very accurate but is not always cut and dry. Market analysts don’t always agree. For example, some may say there’s a 75% chance of a rate hike, while others say there is a 25% chance that the fed will keep rates the same. The Fed Watch Tool often does not result in a 100% probability.
The Velocity of Money
The Velocity of Money is the number of times a dollar is spent over a period of time. If the velocity is increasing, then more transactions are occurring. If the velocity is decreasing, people are saving. The chart shows that as the money supply has been increased, spending has not yet followed through. If velocity increases, inflation will likely increase as well. Shortcomings of this indicator are it lags and is released quarterly, so hindsight analysis must be used rather than foresight using real-time analysis.
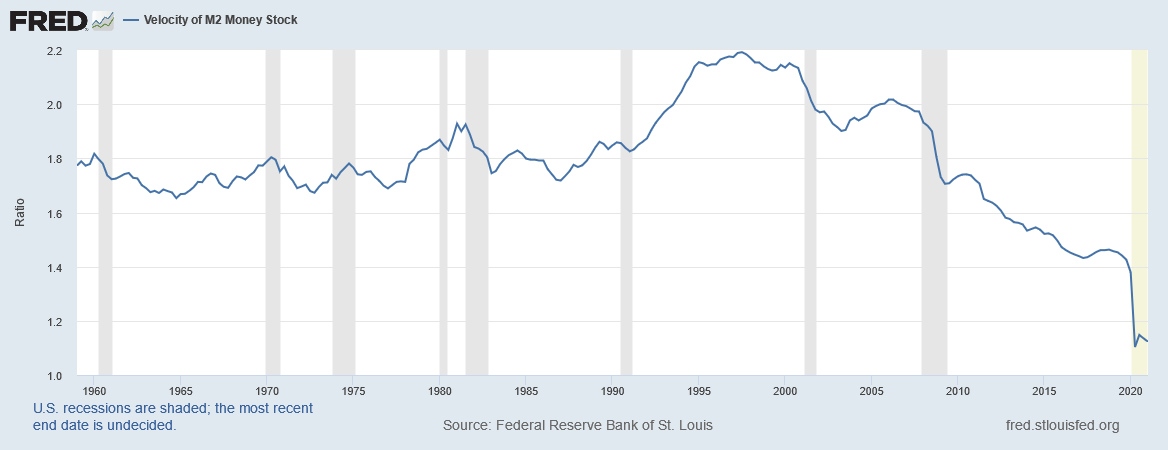
Source: https://fred.stlouisfed.org/series/M2V
Conclusion
According to recent history, stock prices typically, but not always, rise and fall in conjunction with interest rates, contrary to some opinions. Investors should not fear rising interest rates since this indicates a growing economy. The Fed Funds Rate is independently set at FOMC meetings. There is a vast array of tools that can be used to gain insight concerning interest rate adjustments. Some are new, while others have existed from time immemorial. New tools are constantly being found, tested, and shared. In today’s climate, knowing the direction of interest rates is imperative.
