What is Intermarket Analysis?
Download (Login required) Audio PDF
A stock or index does not exist in a vacuum. There are many forces in one market that can impact price movement in another market. The various pressures ultimately impact Supply and Demand. Intermarket Analysis (IMA) seeks to find, observe, and take advantage of the different inside and outside forces to gain insight and understanding of price movement.
Intermarket Analysis (IMA) begins with looking at an investment, such as a stock or index. An inquiry is performed by looking outward into other areas to gain a big picture view and provide context. Understanding past and current conditions can help foresee possible future movement and performance.
Entering or Holding a Position
Entering
A top-down approach is often used to find good investments or determine opportune times to initiate a new position.
Holding
Positions that are held are usually evaluated using a down-top approach.

Micro-Intermarket Analysis and Macro-Intermarket Analysis
A more refined definition can be used to subdivide evaluations.
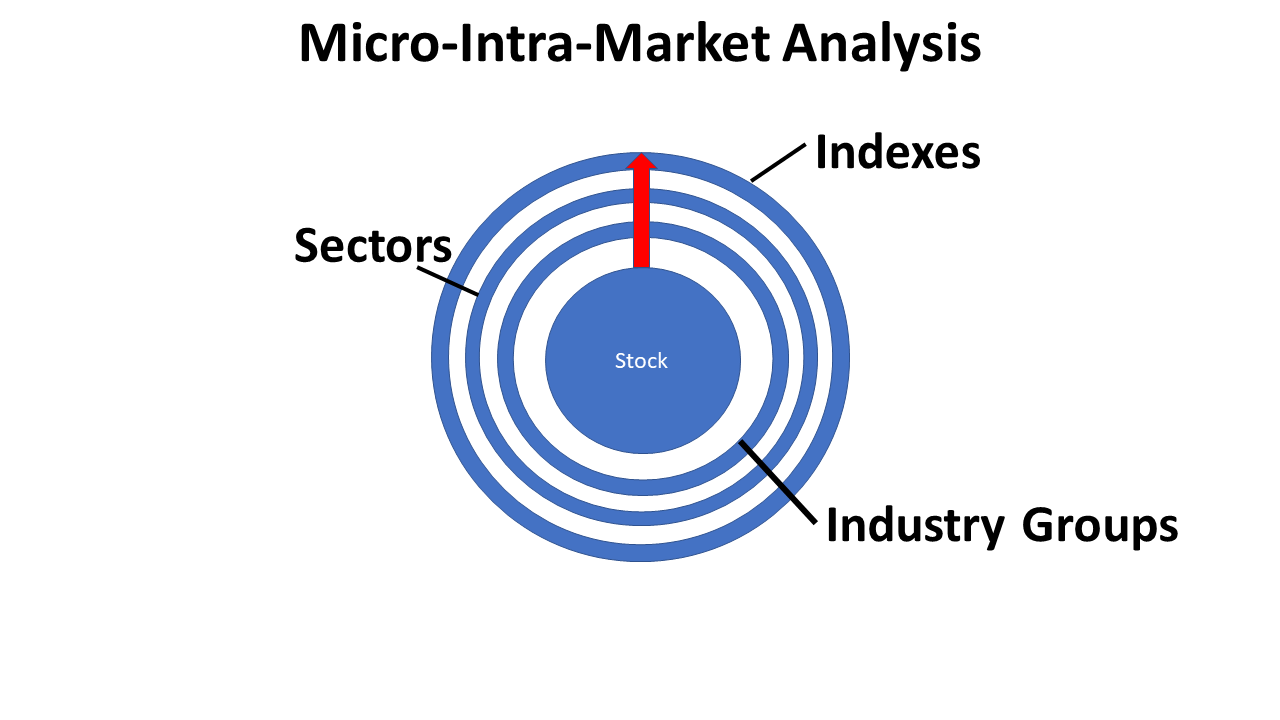
- Micro-Intermarket Analysis
Micro-Intermarket Analysis, also called Intra-market Analysis, stays within the stock market but starts by looking at a stock and moves outward by analyzing Industry Groups, Sectors, and indexes.
An examination looks inward when an index is the base position by analyzing sectors, industry groups, and influential stocks within the index.
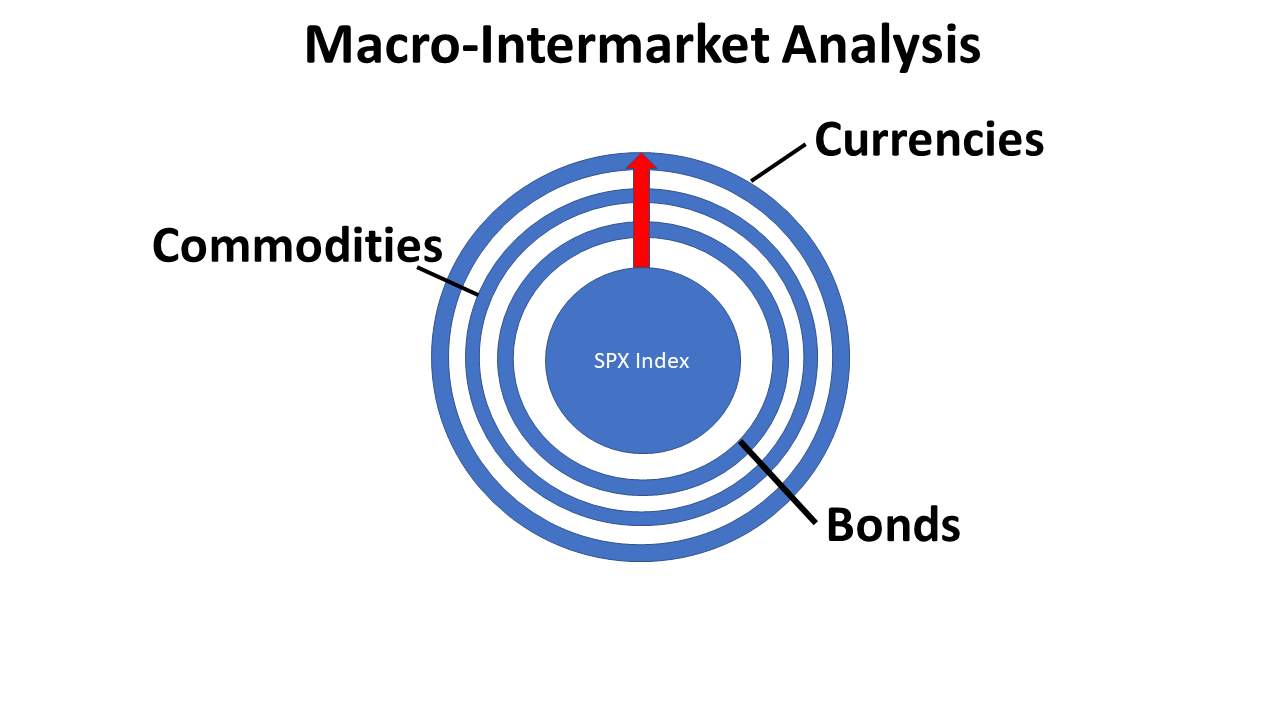
- Macro-Intermarket Analysis
Macro-Intermarket Analysis looks beyond the stock market by studying bonds, commodities, and currencies.
The primary focus of this article is Macro-IMA. The diagram below is intended to illustrate the concept of IMA, not the level of importance of the other markets. Sometimes bonds have the most influence, while, at different times, the US Dollar or commodities may have the most significant impact.
Intermarket Analysis (IMA)
Although Intermarket Analysis (IMA) is not new, it is a discipline made popular over the last twenty years by John Murphy.
Intermarket Analysis
Although outdated, another excellent book is:

What is Intermarket Analysis?
Relationships
Technical Analysis (TA), which uses charts, studies interrelationships between asset classes to identify stages of the business cycle, evaluate current conditions, and improve forecasting abilities. Quite often, it can explain why markets behave in a particular manner. Strong areas can be capitalized upon, and poorly performing areas can be avoided or call the need for hedging or protection.
Intermarket Analysis is a branch of Technical Analysis (TA) that examines the strong correlations between four major asset classes:
- Stocks
- Bonds
- Commodities
- Currencies
There are strong relationships between stocks and bonds, bonds and commodities, and commodities and the Dollar.
Other relationships can also occur, such as commodities or the US Dollar impacting stock prices.
A free explanation of Intermarket Analysis can be found at stockcharts.com
A World of Grey
Intermarket Analysis does not always produce “Black and White” results. As much as we would like to put things in a simple box that always has predictable results, this rarely happens. IMA becomes more complicated when “textbook relationships” do not always behave as expected.
For example, one relationship that is analyzed is Gold and the US Dollar. The basic observation in IMA is the US Dollar and Gold, a commodity, move in opposite directions. Typically, if the US Dollar is rising, gold is declining, and vice versa. While accurate and often apparent, there are times when this relationship performs differently. For much of 2020 and 2021, both gold and the US Dollar have been declining. Other relationships that should occur do not always occur.
The chart below illustrates the US Dollar and Gold prices in 2020-2021

It is detrimental to label IMA relationships as strict rules with guaranteed outcomes. The primary relationships should always be heeded, but other correlations should also be followed once discovered. The best practice is always to be on the lookout for IMA relationships, even if they don’t make sense.
The correlations are uncovered through constant observation. The ebbs and flows of the market need to be understood and followed. Valuable and powerful insight requires developing a skill.
Fluidity & Fixation
The financial markets are constantly fixated on something. Sometimes this is logical and makes sense. Other times, a clear answer is not apparent. Regardless, it is what it is and should be respected. The focus is not necessarily “why” something is happening. The focus should be “what” is happening. The financial media and pundits like to give reasons for everything. This is not a problem, but conclusions are usually made and reported after the fact. We need to see things as they are happening.
How long a relationship lasts is uncertain. An observed correlation may last a few days, weeks, or months. Careful analysis of market conditions is performed daily to uncover what correlations are occurring. The level of influence and proactive measures, if any, become part of the daily plan. This not only applies to short and intermediate-term traders but also to long-term investors.
Over a short period, such as a few days, the markets find something to worry about or justify specific prices to go higher or lower. For example, in early 2021, as the stock market recovered from the short-lived COVID-19 Plunge, there was a strong inverse relationship between the stock market and bonds yields, or interest rates. There are continued inflationary concerns due to stimulus packages and massive liquidity being added to the economy. The situation is ongoing and may take years to play out.
Also, in early 2021, there was a strong inverse relationship between interest rates and tech stocks. If interest rates moved up, tech stocks moved down and vice versa. This does not often happen, at least as strong and as apparent as it did, but when it does, IMA can be used to uncover such a relationship.
Market fixation can change quickly. There can be a reaction or over-reaction in other markets that leads to influencing stock prices. Even a significant price movement may not be caused by anything in particular, such as rumors or conclusions reached by market participants. Still, once it takes hold and influences prices, such events can seem to come out of nowhere unless IMA is implemented.
Geopolitical events may or may not impact the S&P 500. One mistake is to avoid self-interpretation. Just because the markets should react does not mean they will. Also, events that may not seem important may have a significant impact. The markets will signal what is important and what can be ignored. That is why constant observation is good practice.
The markets do not like surprises. Although the world is full of uncertainties, the financial markets like to feel that everything is under control. Events such as Brexit in 2016, and the outbreak of COVID-19 in 2020, caused sudden and severe price movements in all markets. Such moves are typically short-lived, with the major trend resuming once the event passes. However, price movements can be broad and deep, which may trigger stop-loss orders, and risk putting more advanced strategies in danger of becoming extreme losses.
As a side note, personal observation has shown that major market events that have the most significant impact occur while trends were already established. For example, the stock market was hit hard after 9-11. However, the market had already been in a downtrend as the dot-com bust was happening. The terrorist attacks magnified what was already in motion. Events contrary to the primary trend that occur can produce massive movements that often recover relatively quickly. The SPX and other major markets do not “turn on a dime.” There are significant warning signs days, weeks, or even months before the primary trend reverses.
Incidentally, the primary trend is the 50-period Simple Moving Average (SMA) versus the 200-period Simple Moving Average (SMA). When the 50 SMA is above the 200 SMA and climbing, the trend is positive. The trend switches to negative when the 50 SMA is below the 200 SMA and falling.
The chart below is a five-year chart of the SPX

The markets dislike uncertainty. Unknowns or information that is not actionable can often cause the volume to drop off, which can produce wild swings. Often, an attitude of “when in doubt, sell” is followed.
Other Markets Analyzed
For the program I teach, the S&P500 is the primary vehicle of focus. Everything flows from the SPX, including SPX mutual funds, SPX ETFs such as the SPY, and SPY and SPX option contracts. There are other vehicles such as futures contracts, specifically the S&P E-mini, but that is beyond the scope of my program since it is highly leveraged and encourages day-trading. In essence, IMA is performed daily to conclude if other markets are or will impact the SPX.
Included Markets
Many stock Indexes are followed, in addition to the SPX. The DOW, NASDAQ 100, Small-Caps and Mid-Caps, and other SPX indexes such as the SPX Equal Weight Index perform differently during different times of the investment cycle.
Inter-relationships between different indexes
For example, when the SPX is strong and the climate is favorable, Small-Caps and Mid-Caps tend to perform well. Small-Caps and Mid-Cap stocks are seen as having more risk but also potentially having a greater reward. If a portfolio is composed of SPX index funds and ETFs, an investor may desire to “take on a little more risk” by venturing into smaller companies. In a healthy environment, Small-Caps and Mid-Caps may outperform the SPX. However, if there is weakness in smaller companies, yet the SPX continues to perform well, this is a warning sign. The markets have turned more defensive and may be due for a decline.
Foreign & Domestic Markets
Most US investors will likely focus on US stocks and indexes. The forces that can impact US prices are typically easier to understand due to cultural familiarity and access to information.
However, some may look for investment opportunities outside the US. One nice thing is that numerous foreign stocks trade in the US as American Depository Receipts (ADRs). This can also be a drawback which is mainly due to time zones. Since foreign markets are often open while the US markets are closed, price reaction can be significant when trading opens in the US. This can work in favor of an investment if the gap movement is in the desired direction. However, gaps against the desired direction can occur. Not understanding foreign dynamics adds another layer of risk and uncertainty.
Nonetheless, foreign markets, especially stock indexes, are watched and may influence prices in the US. This is especially true at the open. The European markets are winding down and often impact the open in the US. Sometimes this can set the tone for the day or may reverse as the day unfolds.
The Bond Markets (Interest rates)
Bonds have an inverse relationship between prices and yields. If bonds go up, interest rates go down and vice versa.
The relationship between stocks and bonds can change. There are times when stocks and bonds move in tandem, while at other times, there is a decoupling. Bonds are often referred to as “risk-off” investments since they are perceived to be safer. Stocks are referred to as “risk-on” investments and are perceived as being riskier. Of course, this definition is too simple to always be true. Bonds can be risky, and stocks can be safe but believing otherwise is the conventional wisdom of the markets.
Commodities (inflation)
Commodities are raw materials such as coffee, sugar, orange juice, and pork bellies. If the prices for these commodities go up, eventually, this will make its way to the consumer. Higher prices cause inflation, which is feared by the markets. Please click here to read a more in-depth article concerning inflation.
The CRB Index tracks commodity prices and consists of 19 commodities: Aluminum, Cocoa, Coffee, Copper, Corn, Cotton, Crude Oil, Gold, Heating Oil, Lean Hogs, Live Cattle, Natural Gas, Nickel, Orange Juice, RBOB Gasoline, Silver, Soybeans, Sugar and Wheat. If the CRB Index is rising, that may indicate inflation. All commodities are followed, but oil and precious metals are closely tracked. Please click here to read a more in-depth article concerning the CRB Index.
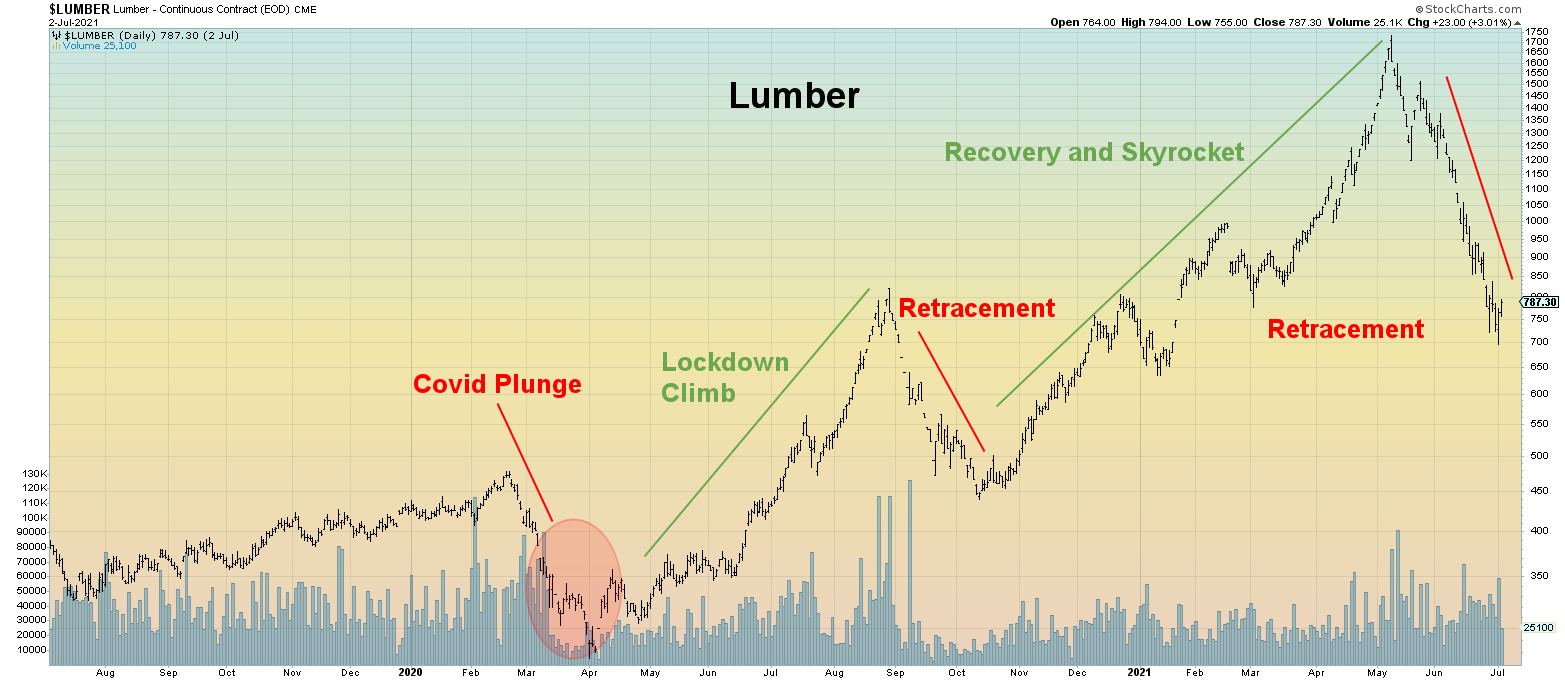
For example, during the COVID-19 lockdowns, the price of lumber skyrocketed. Most participants usually ignore this market. However, the massive increase in prices, which influences everything from home builders to home buyers, made front-page news. Using IMA, this was uncovered well in advance of it becoming pop news.
Below is a two-year chart of Lumber
The Dollar Index
The US Dollar Index is watched closely using IMA, especially in the age of cryptocurrencies. Many are trumpeting the US Dollar’s pending doom, which they believe will be replaced by some form of cryptocurrency. It is yet to be seen how this will play out. In the meantime, everyone is dogmatic about knowing the answer when the end result will likely be something different.
A declining US Dollar is inflationary, whereas a strong US Dollar gives more confidence in the economy. Please click here to read a more in-depth article concerning inflation. Please click here to read a more in-depth article concerning the US Dollar.
The chart below is the US Dollar

Conclusion
IMA should be an integral part of any market participants’ evaluation process of current market conditions. Regardless of which time frame is the primary focus, it is best to observe the interactions of other markets with the stock market. Information can be gathered that can uncover opportunities. Additionally, IMA may help clarify if implementing safety measures such as exiting or implementing hedging is in order. IMA changes daily, but the various markets give off clues that can be spotted. Once IMA is implemented, investors and traders are more empowered to make better decisions.
